
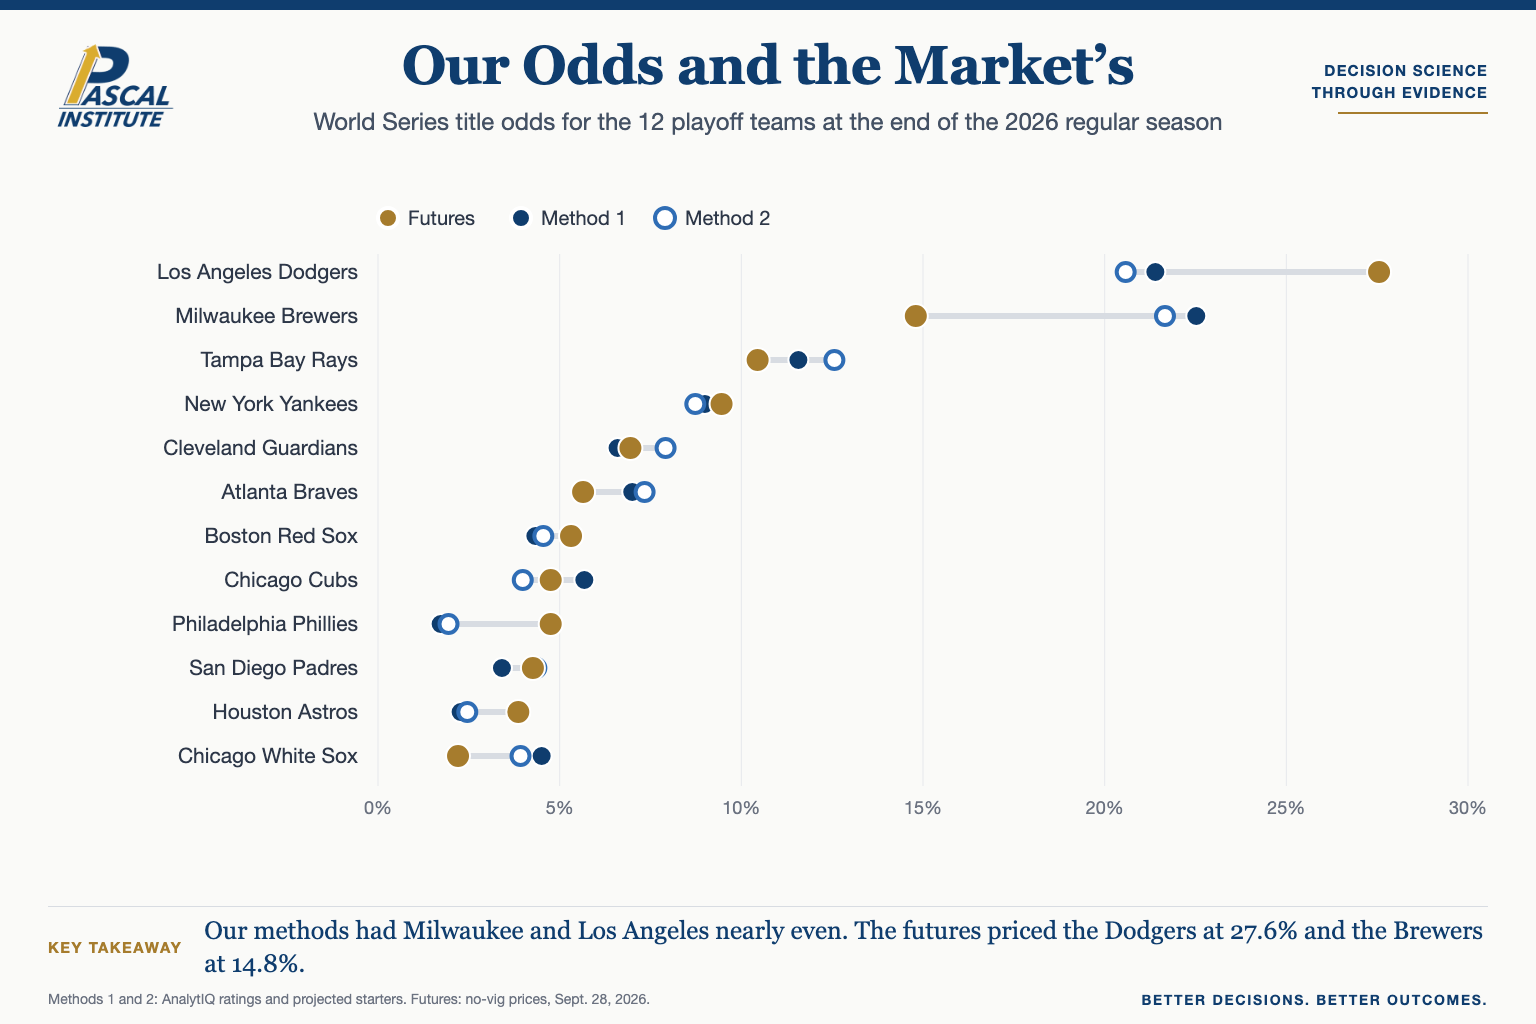
Milwaukee finished the 2026 regular season with the best record in baseball and the highest AnalytIQ team rating. When we built two forecasts of the World Series from those ratings and froze them before the first postseason pitch, both made the Brewers a slight favorite. The betting market did not. Its World Series futures priced the Los Angeles Dodgers almost twice as likely to win as Milwaukee. This article is about that gap, and about the question it raises for anyone who builds a forecast: does it know anything the market does not?
Our first method gave Milwaukee a 22.5 percent chance to win the title and the Dodgers 21.4 percent. Our second gave them 21.7 and 20.6 percent. The futures market, with the bookmakers’ margin removed, priced the Dodgers at 27.6 percent and the Brewers at 14.8 percent. On most of the field the three views agreed closely. On the two best teams they did not, and the rest of this article explains how we tested which view deserved more trust.
Two Ways to Forecast a Bracket
Both methods start from the same place: the AnalytIQ MLB team ratings, published from regular-season run scoring and run prevention, as they stood when the regular season ended. Neither method sees a postseason game. The forecast is frozen, which is what allows it to be scored honestly later.
The first method is a simulation. It turns each team’s rating into a winning percentage and then pulls that percentage toward .500, because a full season of run differential overstates how far apart teams really are. We measured how far to pull it rather than assuming: splitting every team-season into alternating games and correlating the halves gave a full-season reliability of 0.805, which is the same as adding about 39 games of .500 play to every team’s record. Each game is priced from the two teams’ strengths with home field, which won 53.3 percent of regular-season games over the period. The method then plays every series game by game in its real format, including the best-of-three Wild Card round, and repeats the whole postseason 200,000 times, each time drawing every team’s true strength from the uncertainty in its rating.
The second method uses machine learning. Predicting champions directly would leave about ten examples to learn from, one per season, which is far too few. Instead we trained a model on about 22,000 regular-season games from 2015 through 2025, using each team’s ratings as they stood the day before the game, and ran its game probabilities through the same bracket. Using one bracket for both methods means any difference between them comes from how they price a single game.
What a Starting Pitcher Adds
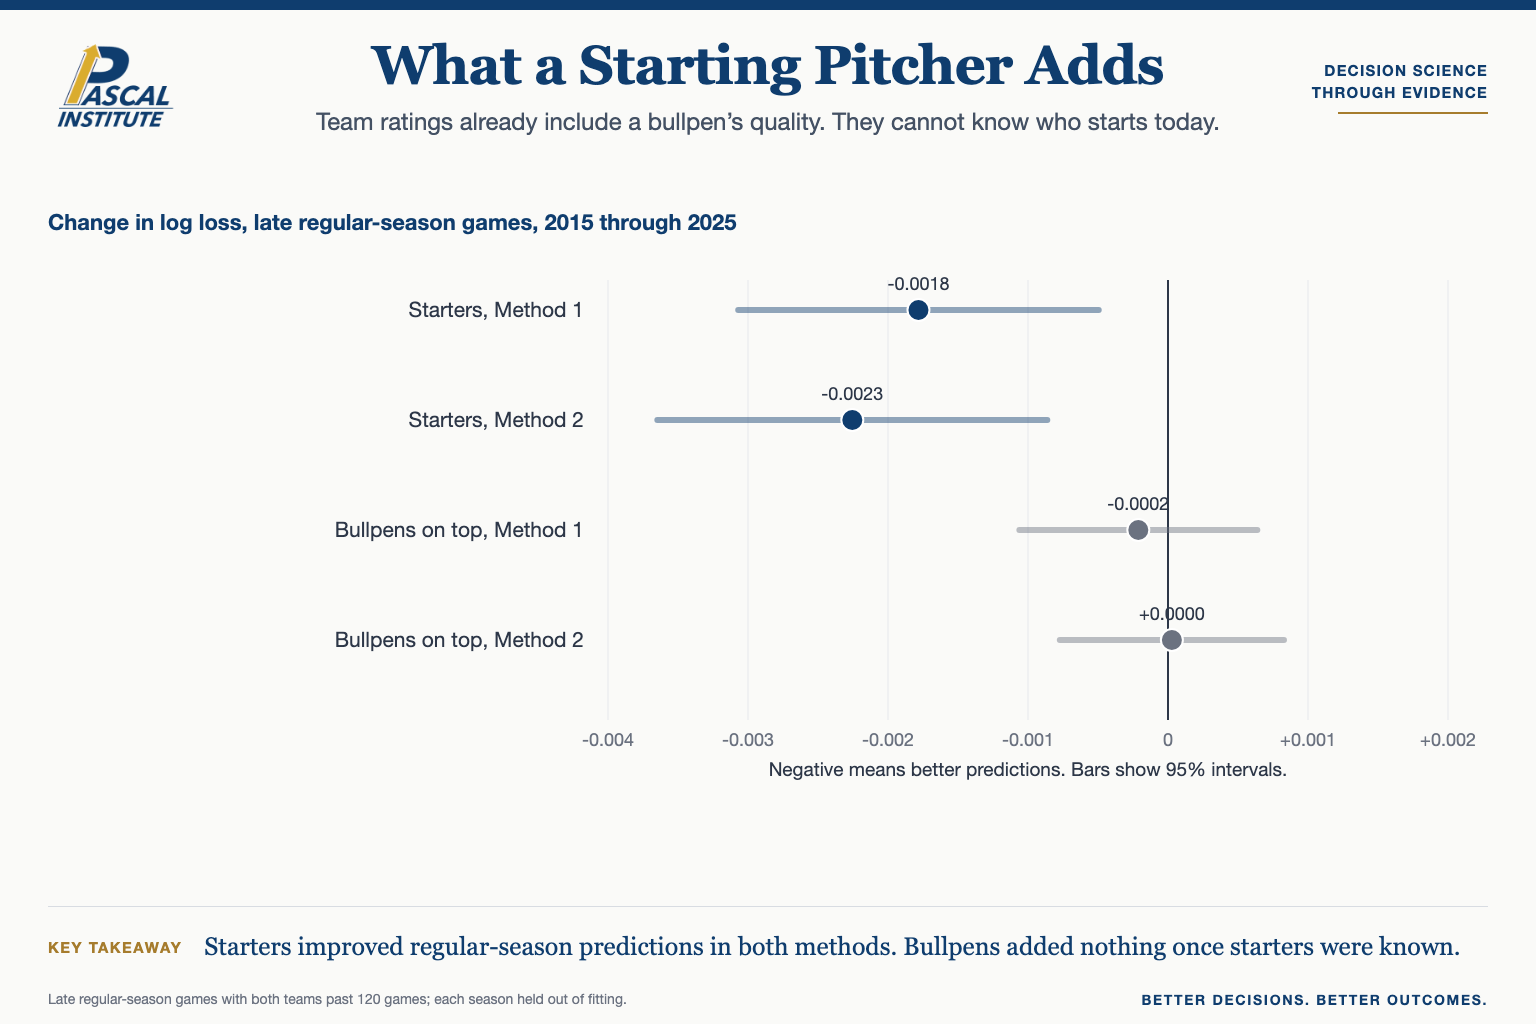
A season rating describes a team’s average. It cannot know who starts tonight, and in baseball that matters. We added each game’s starting pitcher to both methods, measured against his own team’s rotation, because the rating already includes the rotation’s average and counting it twice would overstate the effect. Strikeouts minus walks per batter faced carried nearly all of the signal; earned runs added little once it was known. In the regular season, adding starters improved predictions in both methods, with 95 percent intervals that exclude zero. In the postseason the gain was too small to separate from chance, which is what we would expect when both teams start their best pitchers.
Bullpens were a different story. A team’s bullpen is largely the same group every day, so its quality is already reflected in the runs the team allowed, and the rating has it. Adding bullpen quality changed regular-season predictions by essentially nothing. We also tested the strongest case for bullpens: relievers pitched 47.4 percent of postseason innings over the period, against 40.1 percent in the regular season, and managers lean on their best relievers in October. Projecting each team’s top relievers made our postseason series predictions slightly worse on average, though not by a margin we can distinguish from chance, and certainly not better. The lesson generalizes beyond baseball. An input adds information only when it changes in ways the summary measure cannot already see.
Testing Against Ten Postseasons
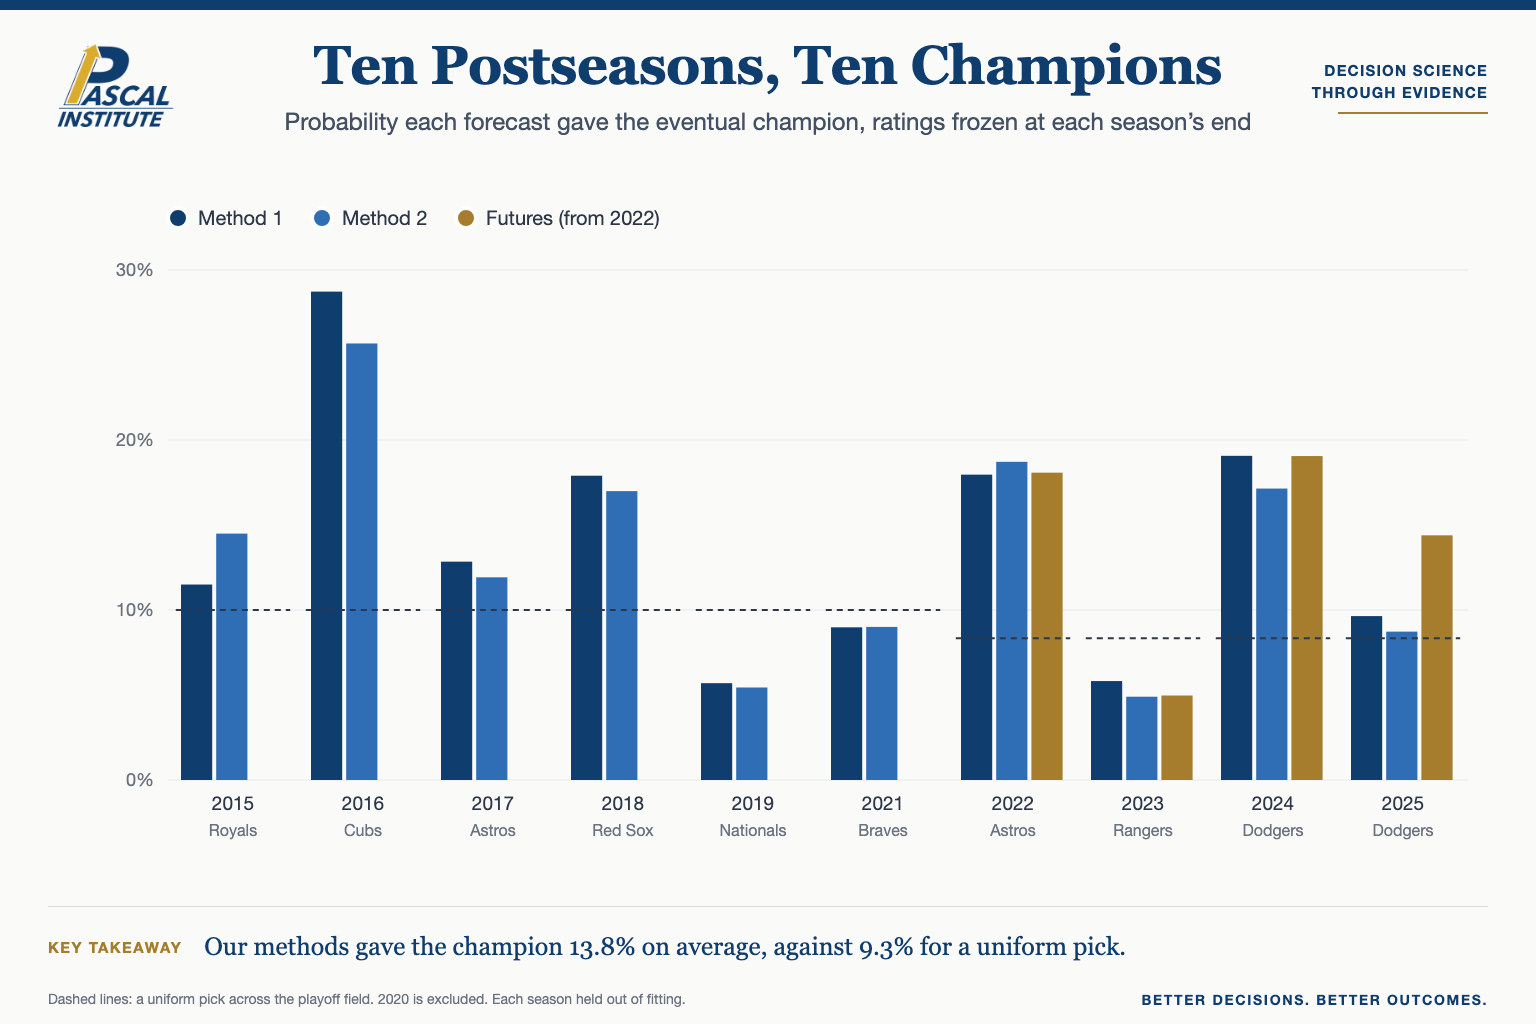
Before trusting either method, we replayed the postseasons from 2015 through 2025, leaving out 2020 and its one-off format. For each season we fit the methods on the other nine, froze the ratings at that season’s end and ran the real bracket. Both methods beat a simple home-field baseline on regular-season games, and both gave the eventual champion more probability than a uniform pick: 13.8 percent on average for the first method and 13.3 percent for the second, against 9.3 percent for picking at random.
We are careful about what this shows. In postseason games and series the methods’ advantage over the baseline was small and could not be distinguished from zero, and ten champions are a description, not a test. The 2019 Nationals and the 2023 Rangers won as long shots under both of our methods, and the 2023 futures agreed. A forecast that gives a champion about 6 percent was not necessarily wrong; outcomes with a 6 percent chance happen.
What the Market Knew
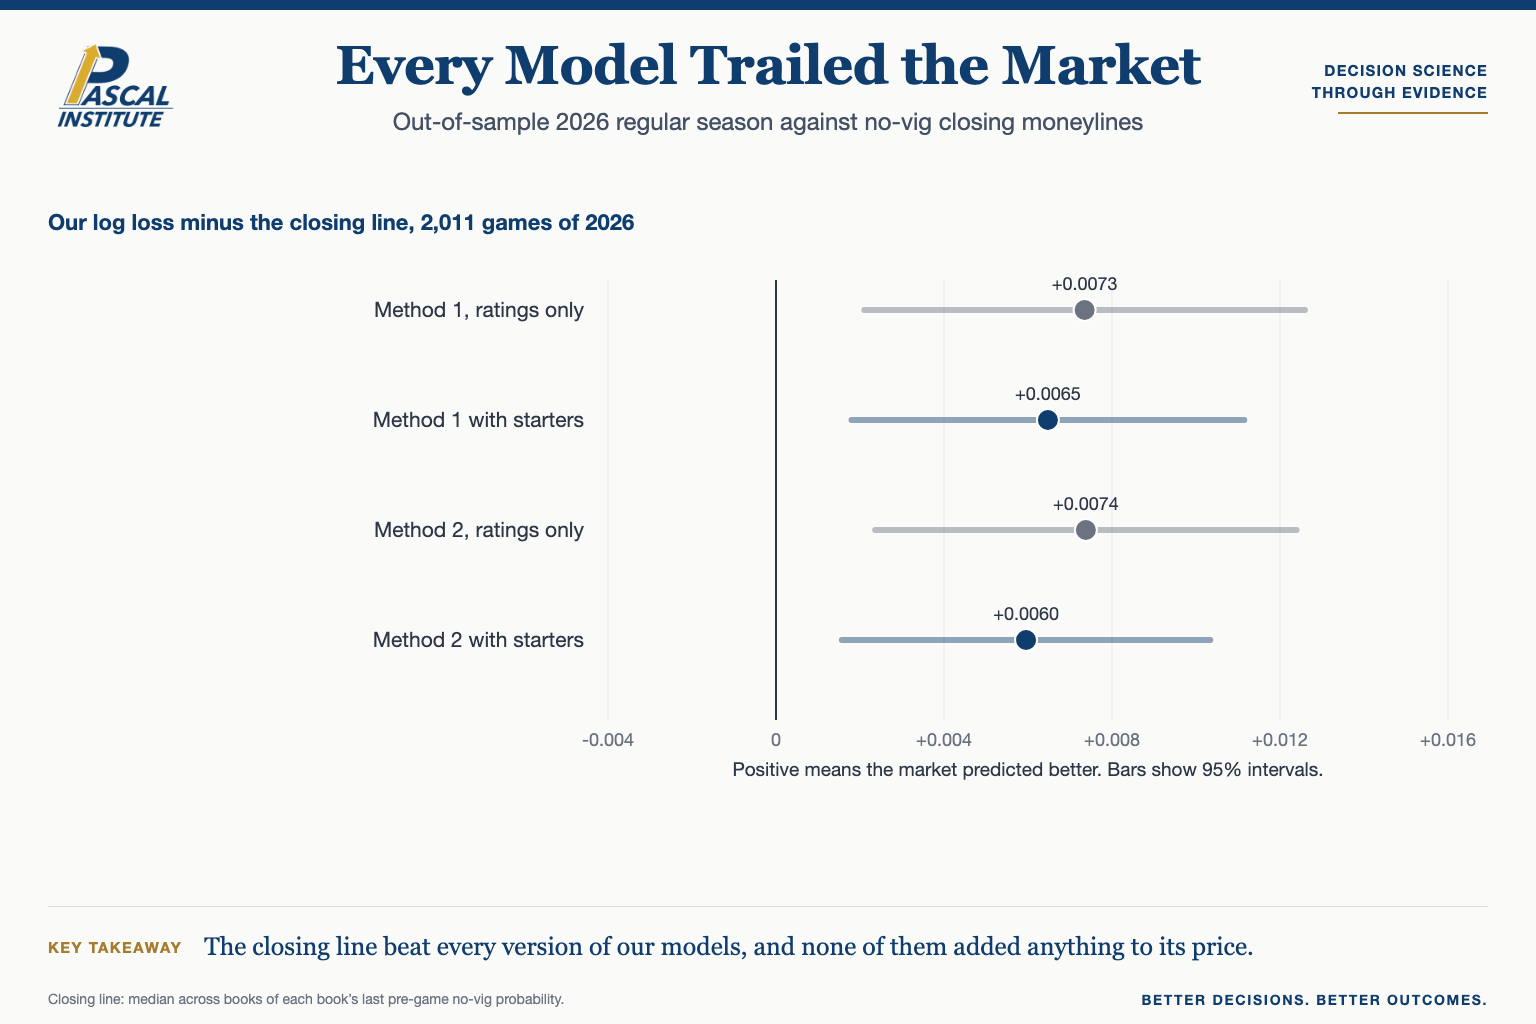
The real test of a forecast is not whether it beats a coin flip but whether it knows something others do not. Betting markets are a demanding standard because their prices move until the moment a game begins and reflect everything bettors and bookmakers can learn. We compared our models with the closing moneyline on 2,011 games of the 2026 regular season, which our models never trained on. The closing line’s log loss was 0.6783. Our headline version, the machine learning model with starters, scored 0.6843, and the difference of 0.0060 points of log loss in the market’s favor has a 95 percent interval of 0.0016 to 0.0103. Every version of our models trailed the market.
The sharper question is whether our models add anything to the market price, even though they trail it. When we blended each model with the closing line and let the data choose the blend, the weight given to our models was indistinguishable from zero: for the machine learning model, -0.08, with a 95 percent interval of -0.52 to 0.35. In plain terms, once you know the market’s price, our forecast tells you nothing more. Team ratings and starting pitchers are public information, and the market had already priced them, along with injuries, lineups and roster news that our ratings do not see.
The same pattern held for the title. For the four seasons where we have end-of-season futures prices, from 2022 through 2025, the futures gave the eventual champion a mean log score of -2.08, against -2.14 and -2.22 for our two methods. Four champions settle nothing, but they point the same way as two thousand games. For 2026, where our forecast and the market disagree about the Dodgers and Brewers, the evidence says the market is more likely to be right.
What a Forecast Is For
None of this makes the forecast useless. It is honest about its uncertainty, it can be checked, and it explains its reasoning in a way a price cannot: we can say how much of a team’s chance comes from its rating, how much from home field and how much from its starting pitcher. For understanding a bracket, that transparency has value. For acting on a forecast, the standard is different. A decision that depends on beating a market needs information the market lacks, and a model built only from public results does not have it.
That is also why we froze the forecast and published it before the outcome. Once the World Series ends we will score all three views against the result, as we have scored the ten postseasons before it. The champion alone will not tell us much, but the record accumulates, and an honest record is the only way to learn whether a forecasting process deserves trust. Where our view and the market’s differ, the most useful question is not which one was right this October but what the market knew that we did not.
Methodology
Every forecast uses only information available at the end of the 2026 regular season. Ratings are the published AnalytIQ MLB team ratings as of October 6, 2026, covering every regular-season game through September 27. Historical seasons use Retrosheet game logs and pitcher lines, rated with the same method, and each season was held out of the fitting used to forecast it.
Read the full methodology, including data sources, the claim ledger and limitations.
References and prior work
- AnalytIQ: 2026 World Series odds
- AnalytIQ: MLB Team Ratings and How Team Ratings work
- Pascal Institute: Not All Field Goals Weigh the Same
- Pascal Institute: Brandon Pfaadt, When the Outcome Hides the Process
- Retrosheet game logs and pitcher lines, 2015 through 2025. The information used here was obtained free of charge from and is copyrighted by Retrosheet. Interested parties may contact Retrosheet at 20 Sunset Rd., Newark, DE 19711.
- The Odds API for game moneylines and historical World Series futures.