MLB · Research
2026 World Series odds
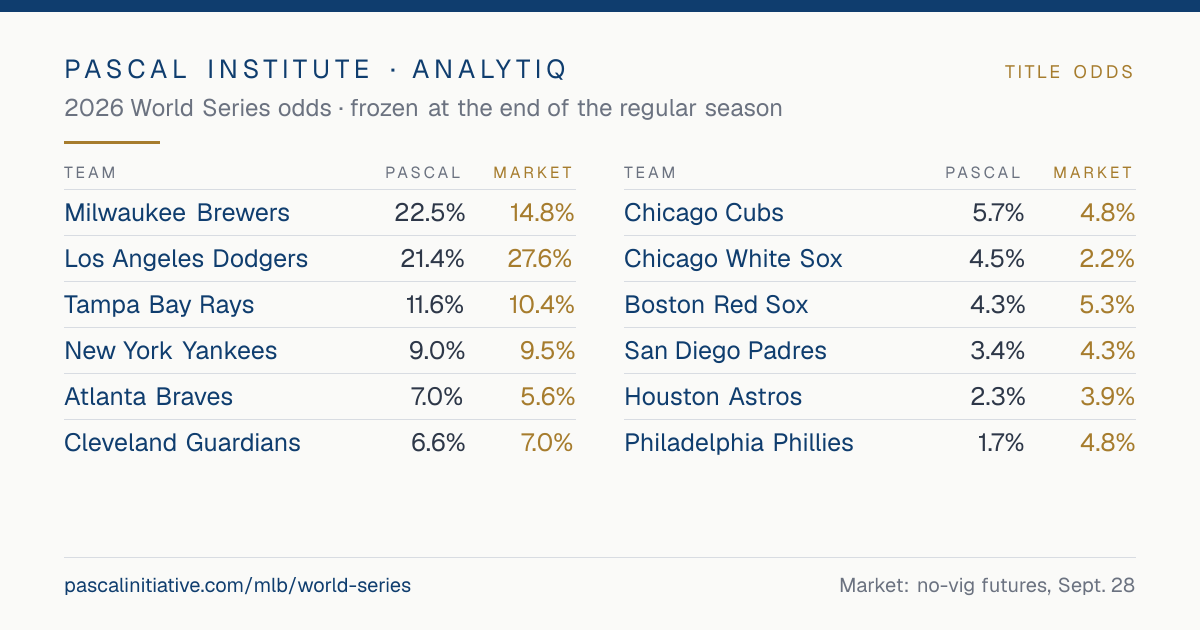
Title odds for all 12 playoff teams, frozen at the end of the 2026 regular season and built from Pascal Team Ratings and each team's projected starting pitchers. Our methods make Milwaukee Brewers the slight favorite at 22.5%. The betting market disagrees: World Series futures favor Los Angeles Dodgers at 27.6%.
Title odds
Each row is a team, sorted by its futures price. Method 1 simulates the bracket; Method 2 is a game-level machine learning model run through the same bracket. Futures are the betting market's World Series prices at the same moment, with the bookmaker margin removed.
| Los Angeles Dodgers | NL 2 | 100–62 | 21.4% | 20.6% | 27.6% | 26.5% |
|---|---|---|---|---|---|---|
| Milwaukee Brewers | NL 1 | 103–59 | 22.5% | 21.7% | 14.8% | 16.7% |
| Tampa Bay Rays | AL 1 | 98–64 | 11.6% | 12.6% | 10.4% | 12.7% |
| New York Yankees | AL 4 | 93–68 | 9.0% | 8.7% | 9.5% | 7.1% |
| Cleveland Guardians | AL 2 | 85–77 | 6.6% | 7.9% | 7.0% | 7.8% |
| Atlanta Braves | NL 3 | 94–68 | 7.0% | 7.3% | 5.6% | 4.4% |
| Boston Red Sox | AL 5 | 87–75 | 4.3% | 4.5% | 5.3% | 4.1% |
| Chicago Cubs | NL 5 | 89–73 | 5.7% | 4.0% | 4.8% | 5.6% |
| Philadelphia Phillies | NL 6 | 88–74 | 1.7% | 1.9% | 4.8% | 6.1% |
| San Diego Padres | NL 4 | 91–71 | 3.4% | 4.4% | 4.3% | 3.2% |
| Houston Astros | AL 3 | 81–81 | 2.3% | 2.5% | 3.9% | 4.0% |
| Chicago White Sox | AL 6 | 84–78 | 4.5% | 3.9% | 2.2% | 1.8% |
Game-line market: team strengths fitted to the last 30 days of closing moneylines, run through our bracket. It sits 1.2 points from the futures on average.
Share these odds
Each link unfurls as a card on social platforms and in messages. Download saves the card image.
Round by round
Chance of reaching each round. Seeds 1 and 2 in each league skip the Wild Card round.
| Team | Div. Series | LCS | World Series | Champion |
|---|---|---|---|---|
| Milwaukee Brewers | 100.0% | 61.3% | 34.4% | 22.5% |
| Los Angeles Dodgers | 100.0% | 61.5% | 32.8% | 21.4% |
| Tampa Bay Rays | 100.0% | 48.6% | 28.5% | 11.6% |
| New York Yankees | 59.5% | 31.9% | 19.9% | 9.0% |
| Atlanta Braves | 63.6% | 27.0% | 12.3% | 7.0% |
| Cleveland Guardians | 100.0% | 50.8% | 20.4% | 6.6% |
| Chicago Cubs | 50.8% | 21.2% | 9.9% | 5.7% |
| Chicago White Sox | 51.7% | 27.5% | 12.2% | 4.5% |
| Boston Red Sox | 40.5% | 19.4% | 11.0% | 4.3% |
| San Diego Padres | 49.2% | 17.5% | 6.8% | 3.4% |
| Houston Astros | 48.3% | 21.7% | 8.0% | 2.3% |
| Philadelphia Phillies | 36.4% | 11.4% | 3.8% | 1.7% |
| Team | Div. Series | LCS | World Series | Champion |
|---|---|---|---|---|
| Milwaukee Brewers | 100.0% | 61.4% | 34.0% | 21.7% |
| Los Angeles Dodgers | 100.0% | 60.2% | 32.4% | 20.6% |
| Tampa Bay Rays | 100.0% | 49.3% | 29.1% | 12.6% |
| New York Yankees | 59.1% | 31.0% | 18.9% | 8.7% |
| Cleveland Guardians | 100.0% | 53.2% | 22.3% | 7.9% |
| Atlanta Braves | 63.1% | 27.6% | 13.0% | 7.3% |
| Boston Red Sox | 40.9% | 19.7% | 11.1% | 4.5% |
| San Diego Padres | 54.4% | 20.8% | 8.6% | 4.4% |
| Chicago Cubs | 45.6% | 17.8% | 7.6% | 4.0% |
| Chicago White Sox | 49.5% | 24.8% | 10.5% | 3.9% |
| Houston Astros | 50.5% | 22.1% | 8.1% | 2.5% |
| Philadelphia Phillies | 36.9% | 12.2% | 4.3% | 1.9% |
Projected rotations
Each team's top four starters from its last 30 days, best first; the ace starts Game 1 of every series. The number is the change, in percentage points, in a near-even game's win probability when he starts instead of his team's average starter.
| Team | Games 1 and 5 | Games 2 and 6 | Games 3 and 7 | Game 4 |
|---|---|---|---|---|
| Atlanta Braves | Chris Sale+6.2 pts · 27 GS | Tyler Mahle+0.8 pts · 27 GS | Reynaldo López-0.3 pts · 13 GS | AJ Smith-Shawver-1.6 pts · 5 GS |
| Boston Red Sox | Payton Tolle+2.6 pts · 26 GS | Jake Bennett-0.1 pts · 19 GS | Ranger Suarez-0.2 pts · 28 GS | Sonny Gray-0.2 pts · 29 GS |
| Chicago Cubs | Shota Imanaga+3.0 pts · 32 GS | Kevin Gausman+2.3 pts · 32 GS | Matthew Boyd-0.8 pts · 22 GS | David Peterson-1.0 pts · 23 GS |
| Chicago White Sox | Sean Burke+1.9 pts · 27 GS | Sean Newcomb+1.6 pts · 6 GS | David Sandlin+1.3 pts · 6 GS | Bryan Hudson+0.8 pts · 9 GS |
| Cleveland Guardians | Gavin Williams+3.9 pts · 32 GS | Parker Messick+1.6 pts · 32 GS | Foster Griffin-0.2 pts · 31 GS | Daniel Espino-1.3 pts · 3 GS |
| Houston Astros | Hunter Brown+2.3 pts · 20 GS | Peter Lambert+1.9 pts · 29 GS | Hayden Wesneski+0.5 pts · 11 GS | Miguel Ullola+0.5 pts · 2 GS |
| Los Angeles Dodgers | Tarik Skubal+2.7 pts · 26 GS | Tyler Glasnow+1.5 pts · 13 GS | Yoshinobu Yamamoto+0.3 pts · 28 GS | Blake Snell+0.1 pts · 9 GS |
| Milwaukee Brewers | Jacob Misiorowski+5.0 pts · 30 GS | Logan Henderson+1.1 pts · 18 GS | Kyle Harrison-0.1 pts · 24 GS | Dustin May-2.6 pts · 31 GS |
| New York Yankees | Cam Schlittler+3.1 pts · 33 GS | Gerrit Cole+0.5 pts · 22 GS | Max Fried-1.3 pts · 20 GS | Carlos Rodón-1.5 pts · 16 GS |
| Philadelphia Phillies | Jesús Luzardo+1.8 pts · 29 GS | Zack Wheeler+1.2 pts · 28 GS | Cristopher Sánchez+1.1 pts · 33 GS | Aaron Nola-2.0 pts · 33 GS |
| San Diego Padres | Nick Pivetta+5.0 pts · 8 GS | Casey Mize+1.8 pts · 26 GS | Michael King+1.3 pts · 32 GS | Walker Buehler+0.9 pts · 32 GS |
| Tampa Bay Rays | Ian Seymour+3.2 pts · 16 GS | Drew Rasmussen+2.0 pts · 30 GS | Griffin Jax+0.4 pts · 23 GS | Freddy Peralta-2.0 pts · 32 GS |
How the methods did in past postseasons
Each season was held out of fitting, with ratings frozen at its end and the real bracket replayed. Futures prices are available from 2022. 2020 is excluded.
| Season | Champion | Method 1 | Method 2 | Futures | Uniform |
|---|---|---|---|---|---|
| 2015 | Kansas City Royals | 11.5% | 14.5% | — | 10.0% |
| 2016 | Chicago Cubs | 28.7% | 25.7% | — | 10.0% |
| 2017 | Houston Astros | 12.8% | 11.9% | — | 10.0% |
| 2018 | Boston Red Sox | 17.9% | 17.0% | — | 10.0% |
| 2019 | Washington Nationals | 5.7% | 5.4% | — | 10.0% |
| 2021 | Atlanta Braves | 9.0% | 9.0% | — | 10.0% |
| 2022 | Houston Astros | 18.0% | 18.7% | 18.1% | 8.3% |
| 2023 | Texas Rangers | 5.8% | 4.9% | 5.0% | 8.3% |
| 2024 | Los Angeles Dodgers | 19.1% | 17.1% | 19.1% | 8.3% |
| 2025 | Los Angeles Dodgers | 9.6% | 8.7% | 14.4% | 8.3% |
| Method | Late season | Playoff games | Series | On champion |
|---|---|---|---|---|
| Method 1: simulation | 0.6736 | 0.6895 | 0.6808 | 13.8% |
| Method 2: ML | 0.6734 | 0.6905 | 0.6856 | 13.3% |
| Method 1, team ratings only | 0.6754 | 0.6893 | 0.6832 | 13.5% |
| Method 2, team ratings only | 0.6757 | 0.6894 | 0.6861 | 12.9% |
| Method 1 with bullpens | 0.6734 | 0.6915 | 0.6938 | 12.8% |
| Method 2 with bullpens | 0.6735 | 0.6918 | 0.6959 | 12.3% |
| Home field only | 0.6923 | 0.6909 | 0.6931 | 9.3% |
Against the betting market
On 2,011 games of the 2026 regular season, which our models never trained on, the closing moneyline had a log loss of 0.6783. A positive difference means the market predicted better. The weight is how much a model adds when blended with the market price; zero means nothing.
| Model | Log loss | Minus market (95% interval) | Weight (95% interval) |
|---|---|---|---|
| Method 2, team ratings only | 0.6857 | +0.0074 (+0.0024 to +0.0124) | -0.05 (-0.43 to +0.33) |
| Method 2 with bullpens | 0.6841 | +0.0057 (+0.0016 to +0.0099) | -0.14 (-0.61 to +0.32) |
| Method 2: ML | 0.6843 | +0.0060 (+0.0016 to +0.0103) | -0.08 (-0.52 to +0.35) |
| Method 1, team ratings only | 0.6857 | +0.0073 (+0.0021 to +0.0126) | 0.00 (-0.36 to +0.36) |
| Method 1 with bullpens | 0.6841 | +0.0058 (+0.0014 to +0.0101) | -0.08 (-0.52 to +0.36) |
| Method 1: simulation | 0.6848 | +0.0065 (+0.0018 to +0.0111) | -0.05 (-0.46 to +0.36) |
The market beats every model, and no model adds anything to its price. Ratings and starting pitchers are public information that the market already uses.
The 2026 postseason so far
The frozen pre-postseason chance that the team with home field wins each series. One postseason shows little; this is for illustration.
| Round | Home field | Opponent | Method 1 | Method 2 | Result |
|---|---|---|---|---|---|
| WC | Atlanta Braves | Philadelphia Phillies | 63.9% | 63.1% | Atlanta Braves won 2–1 |
| WC | Houston Astros | Chicago White Sox | 48.4% | 50.5% | Chicago White Sox won 2–0 |
| WC | San Diego Padres | Chicago Cubs | 49.3% | 54.4% | San Diego Padres won 2–0 |
| WC | New York Yankees | Boston Red Sox | 59.5% | 59.1% | New York Yankees won 2–0 |
| DS | Milwaukee Brewers | San Diego Padres | 65.2% | 61.8% | Milwaukee Brewers won 3–1 |
| DS | Tampa Bay Rays | New York Yankees | 46.5% | 47.5% | Tampa Bay Rays won 3–0 |
| DS | Los Angeles Dodgers | Atlanta Braves | 57.9% | 56.3% | Los Angeles Dodgers won 3–1 |
| DS | Cleveland Guardians | Chicago White Sox | 47.3% | 50.0% | Cleveland Guardians won 3–2 |
| LCS | Milwaukee Brewers | Los Angeles Dodgers | 51.7% | 51.4% | In progress, 1–0 |
How the forecast works
Both methods start from the published MLB Team Ratings as of October 6, 2026. Method 1 turns each team's Pythagorean winning percentage into a strength, pulled toward .500 as if a full season carried 39.3 extra games of .500 play, and plays every series game by game with home field worth a 53.3% home win rate. Method 2 is a logistic regression trained on about 22,000 regular-season games from 2015 to 2025, using each team's ratings as of the day before.
Both add the starting pitcher, measured against his own team's rotation by strikeouts minus walks and earned runs. Starters pitch fewer postseason innings, so their effect is scaled by 0.88 in October. Bullpens were tested and added nothing measurable, so they are left out.
Futures prices are no-vig World Series prices from several sportsbooks at noon UTC on the day after the regular season ended.