
The scene that follows is a composite rather than a single game, but every baseball fan has watched it unfold. A starting pitcher is deep into his pitch count in the sixth inning, protecting a one-run lead. The heart of the order is coming up for the third time, and a reliever has been throwing in the bullpen since the inning began. The manager walks to the mound, takes the ball and signals for the reliever. Two pitches later, the ball is in the seats and the second-guessing has already started.
Had the reliever struck out the side, the same move would have been called decisive. Had the starter stayed in and allowed the home run, the manager would have been criticized for waiting too long. The argument after a pitching change almost always begins with what happened next. That habit is familiar from our Brandon Pfaadt case study, where a scoreless inning concealed what the pitches themselves revealed. A result can tell us that something went well or badly, but it cannot tell us whether the choice was sound when it was made.
We wanted to judge pitching changes the other way around. Instead of starting with the home run, we started with the moment before each batter and asked what was knowable then. That meant pricing the choice between the starter and the reliever before every hitter a starter faced, not just at the moment he was removed. Across the 2026 season, we modeled 99,072 batter-level comparisons from 3,632 starts. Of those, 84,501 were observed keep-or-pull moments, and 14,571 were extrapolations after a starter had already left, used only to price pulls that came too early. What we found is that the decision fans argue about is usually much smaller than the argument itself.
A Decision Made Before Every Batter
A pitching change looks like a single event, but it is really the last of many decisions. Before each batter, the manager can leave the starter in for one more hitter or bring in a reliever now. Keeping him is a choice just as much as removing him. We therefore treated every plate appearance a starter faced as a decision point, along with the moment of his removal and a few batters beyond it. For each one, we compared the modeled win probability with the starter facing the next hitter against the same hitter facing the reliever who actually entered.
Two terms carry the rest of this article. Win probability is the chance that a team goes on to win the game from its current situation, given the score, the inning, the outs and the runners on base. We measure differences in points, where one point is the gap between, say, a 55 percent and a 56 percent chance of winning. We call the difference between the reliever's number and the starter's number the margin. A margin above zero means the reliever was the better bet for that hitter, and a margin below zero means the starter was.
Every estimate uses only information available before that day's game. Hitter and pitcher talent come from earlier games, shrunk toward league averages so that a few good weeks do not dominate. The starter's condition includes how many times he had faced the lineup, his pitch count, his fastball velocity compared with his own season baseline and his days of rest. The familiar penalty for a third trip through the order appears clearly in the 2026 data. Hitters gained about 0.013 runs per plate appearance the third time they faced a starter compared with the first, with a 95 percent range of 0.006 to 0.020. Mitchel Lichtman documented this penalty more than a decade ago, and more recent work by Ryan Brill, Sameer Deshpande and Abraham Wyner finds that the decline is gradual rather than a sudden drop at the third trip. Our estimate does not separate the two.
Teams have reshaped their staffs around this decision, favoring shorter starts and deeper bullpens, as Ben Lindbergh has documented. One piece of the decision cannot be observed directly. Using a reliever now has a cost later, because bullpen arms are limited and a reliever used today may not be available tomorrow. No team publishes the value it places on that cost, and it changes with the schedule and the state of the bullpen. Rather than assume a single number, we asked what bullpen cost would make each choice break even. That is the same logic we used to price an ABS challenge in Pricing an ABS Challenge and a long field goal in Not All Field Goals Weigh the Same.
Most Moments Are Too Close to Call
The first finding is about size. Across the 84,501 observed moments, the typical size of the margin, whichever way it pointed, was about 0.16 points of win probability. That is a small number for a decision that generates so much debate. It is also far smaller than our uncertainty about the players' talent. When we redrew each hitter's and pitcher's talent 200 times, the typical range of plausible margins was about 1.25 points wide. Those ranges reflect talent alone and leave out other sources of error, including the form of our models and our win-probability model, whose predictions were off by more than our three-point standard in some ranges when we checked them against 229 games it had not seen. For that reason every win-probability result in this article is also reported in runs in the methodology.
That range needs a plain explanation, because it drives everything that follows. We never know a player's true ability, only his record so far. A hypothetical hitter batting .280 after 300 at-bats might really be a .260 hitter who has been lucky or a .300 hitter who has not, and the same uncertainty applies to both pitchers. To account for it, we reran each comparison 200 times, each time with a slightly different but believable version of the three players' abilities. The 90 percent talent range is the span that holds the middle 180 of those 200 answers, after setting aside the ten most extreme at each end.
A hypothetical moment shows how this works. Suppose our best estimate favors the reliever by 0.2 points, but the 200 reruns run from 0.4 points in favor of the starter to 0.8 points in favor of the reliever. That span is 1.2 points wide and includes both answers, so we cannot say which pitcher was the better choice. Figure 1 sets the two quantities side by side for every observed moment. The top panel shows how much the choice mattered, and the bottom panel shows how wide the range of believable answers was.
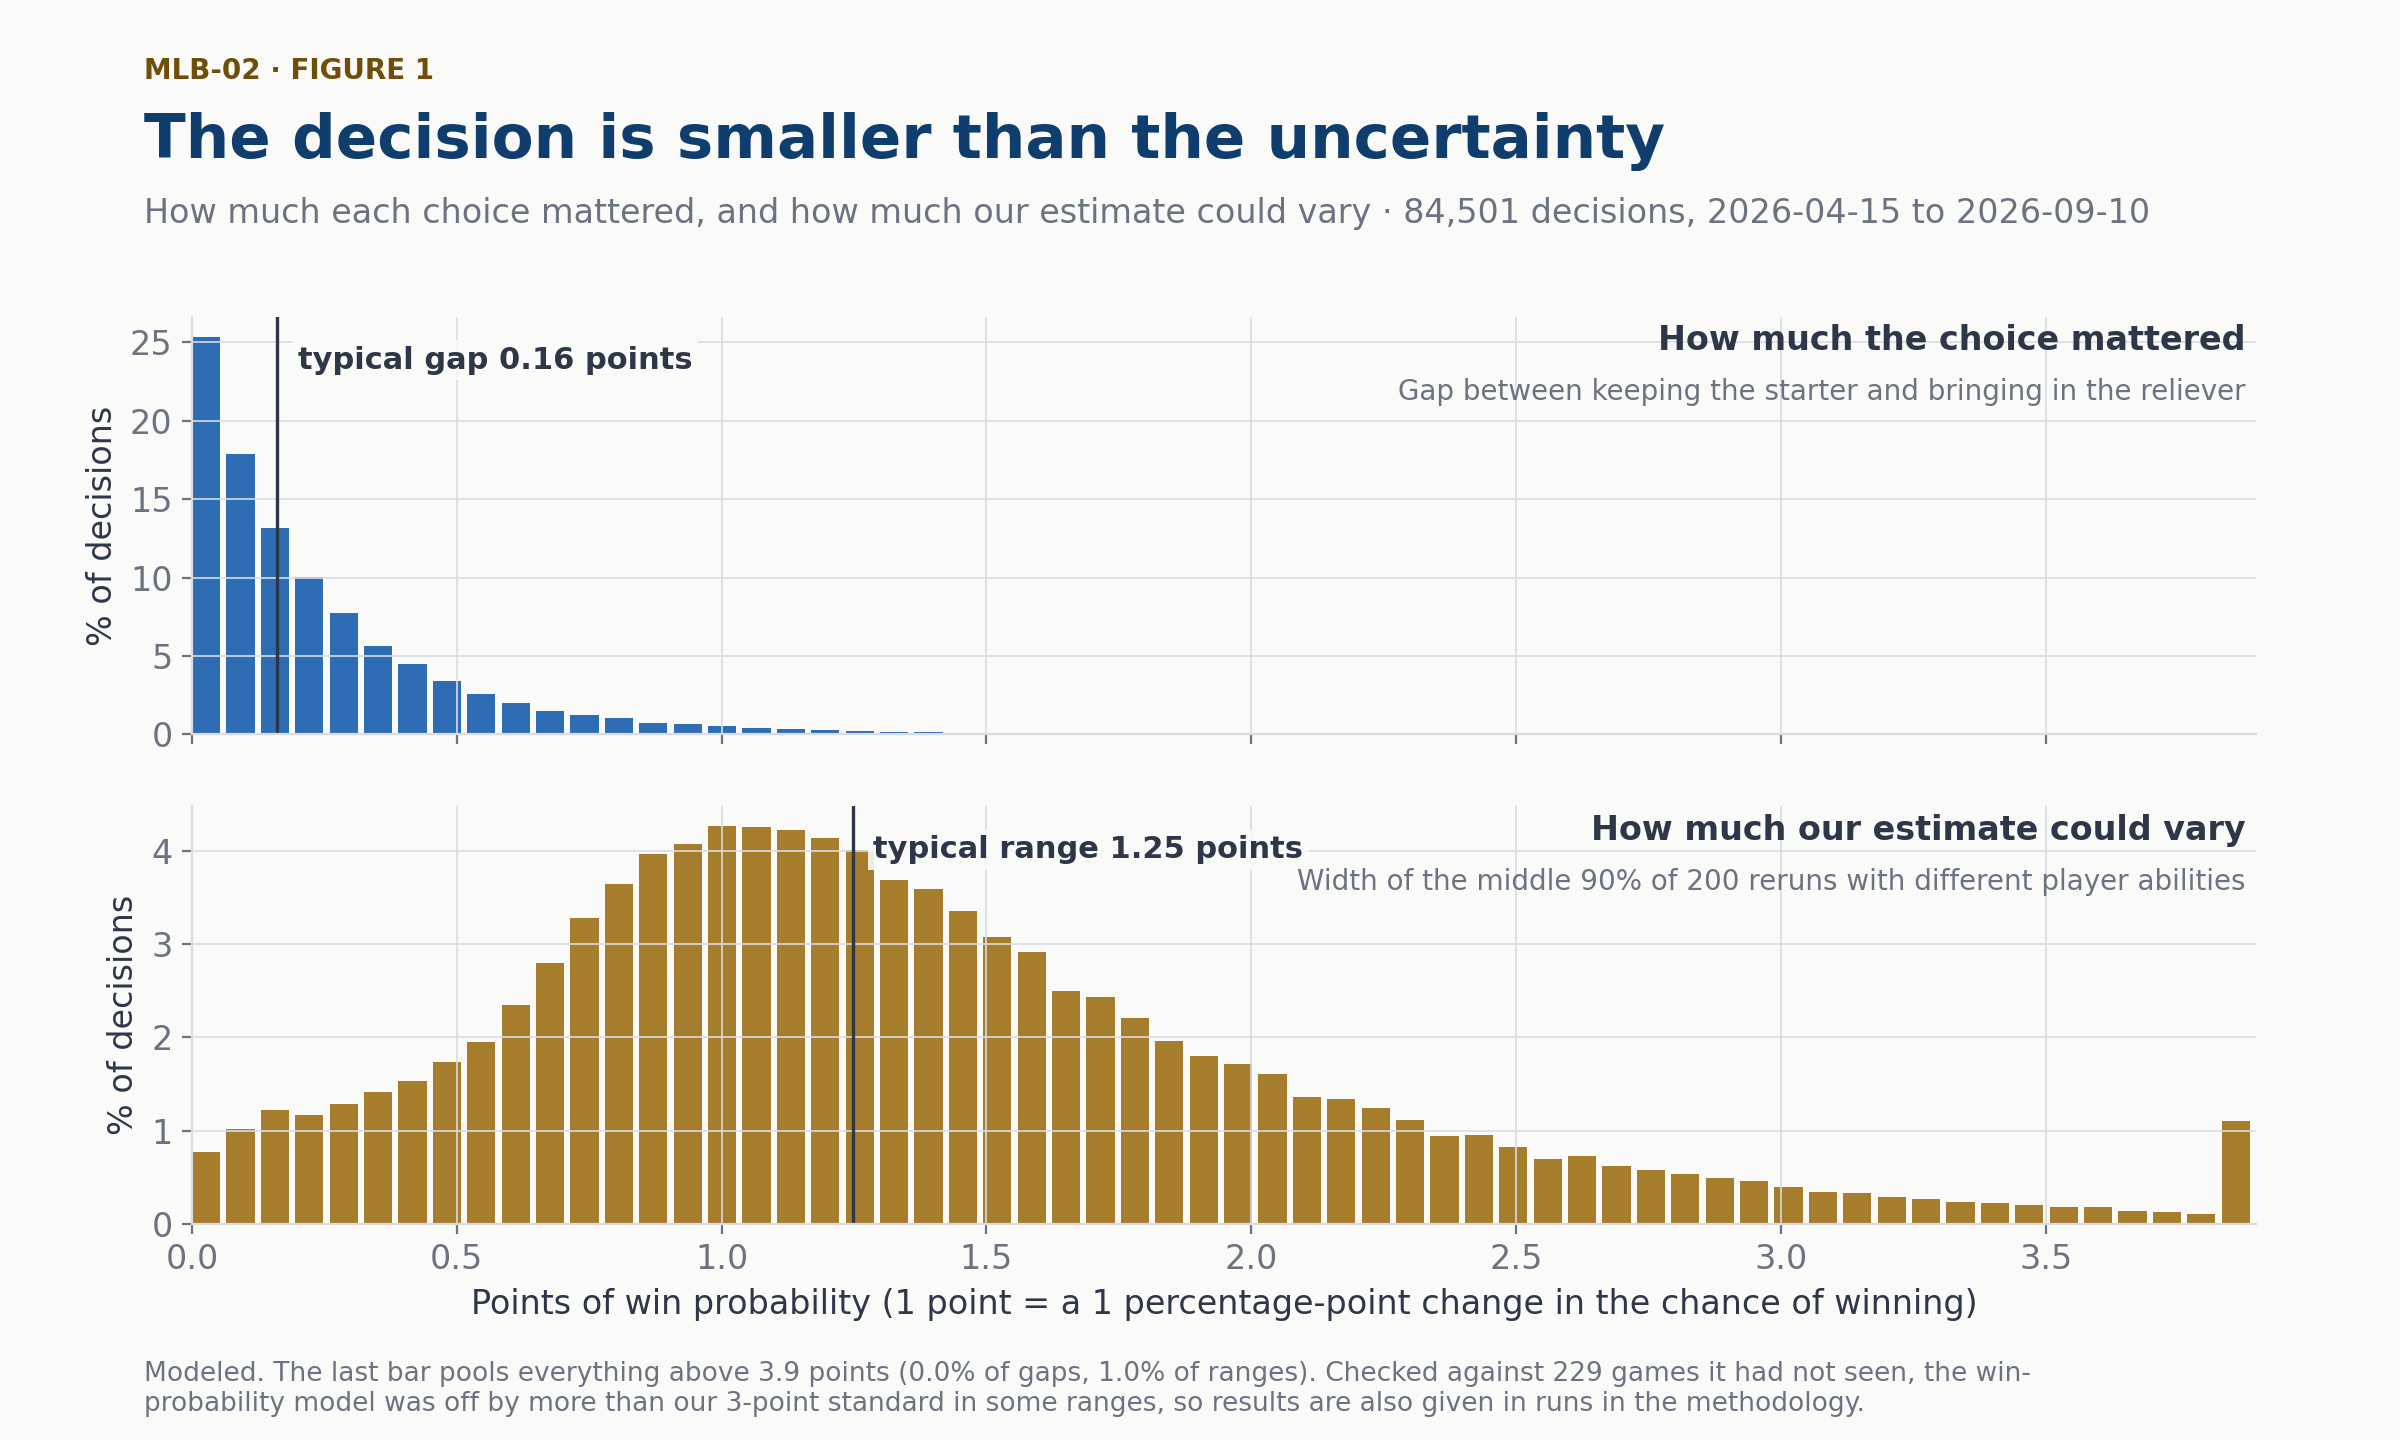
We counted a moment as too close to call when the assumed bullpen cost fell inside the margin's 90 percent talent range, or when the margin sat within 0.25 points of that cost, a small allowance for differences too slight to matter in practice. With the bullpen assumed to cost nothing, about 96 percent of observed moments met that rule. Almost all of them qualified through the talent range alone, which contained zero for 95.6 percent of moments, while the allowance added only 0.3 points. Removing the allowance or doubling it to 0.5 points moved the share by less than one point, and repeating the talent draws with a different random seed or with 1,000 draws changed it by less than half a point. For most moments, our model cannot say which pitcher was the better choice for the next hitter, given its uncertainty about the players' talent.
This does not mean pitching changes are unimportant. A starter who stays in for a whole extra inning faces several hitters, and small edges can add up across a season. It means that the individual moment a fan remembers rarely carries the weight the argument gives it. A manager who leaves a starter in for one more hitter is usually choosing between two options of nearly equal value. The outcome that follows says much more about the hitter's swing than about the quality of the call.
The Margin Moves With Every Batter
We expected the margin to climb steadily as a starter tired, crossing a threshold at some point that a good manager would recognize. The data told a more complicated story. Within a start, the margin moved from one batter to the next about as much as its typical size. The hitter at the plate, the base and out situation and the reliever's matchup all change from one batter to the next, and each moves the comparison. The margin often changed more between consecutive batters than a simple fatigue threshold would suggest, although we have not measured how much of that movement each factor explains.
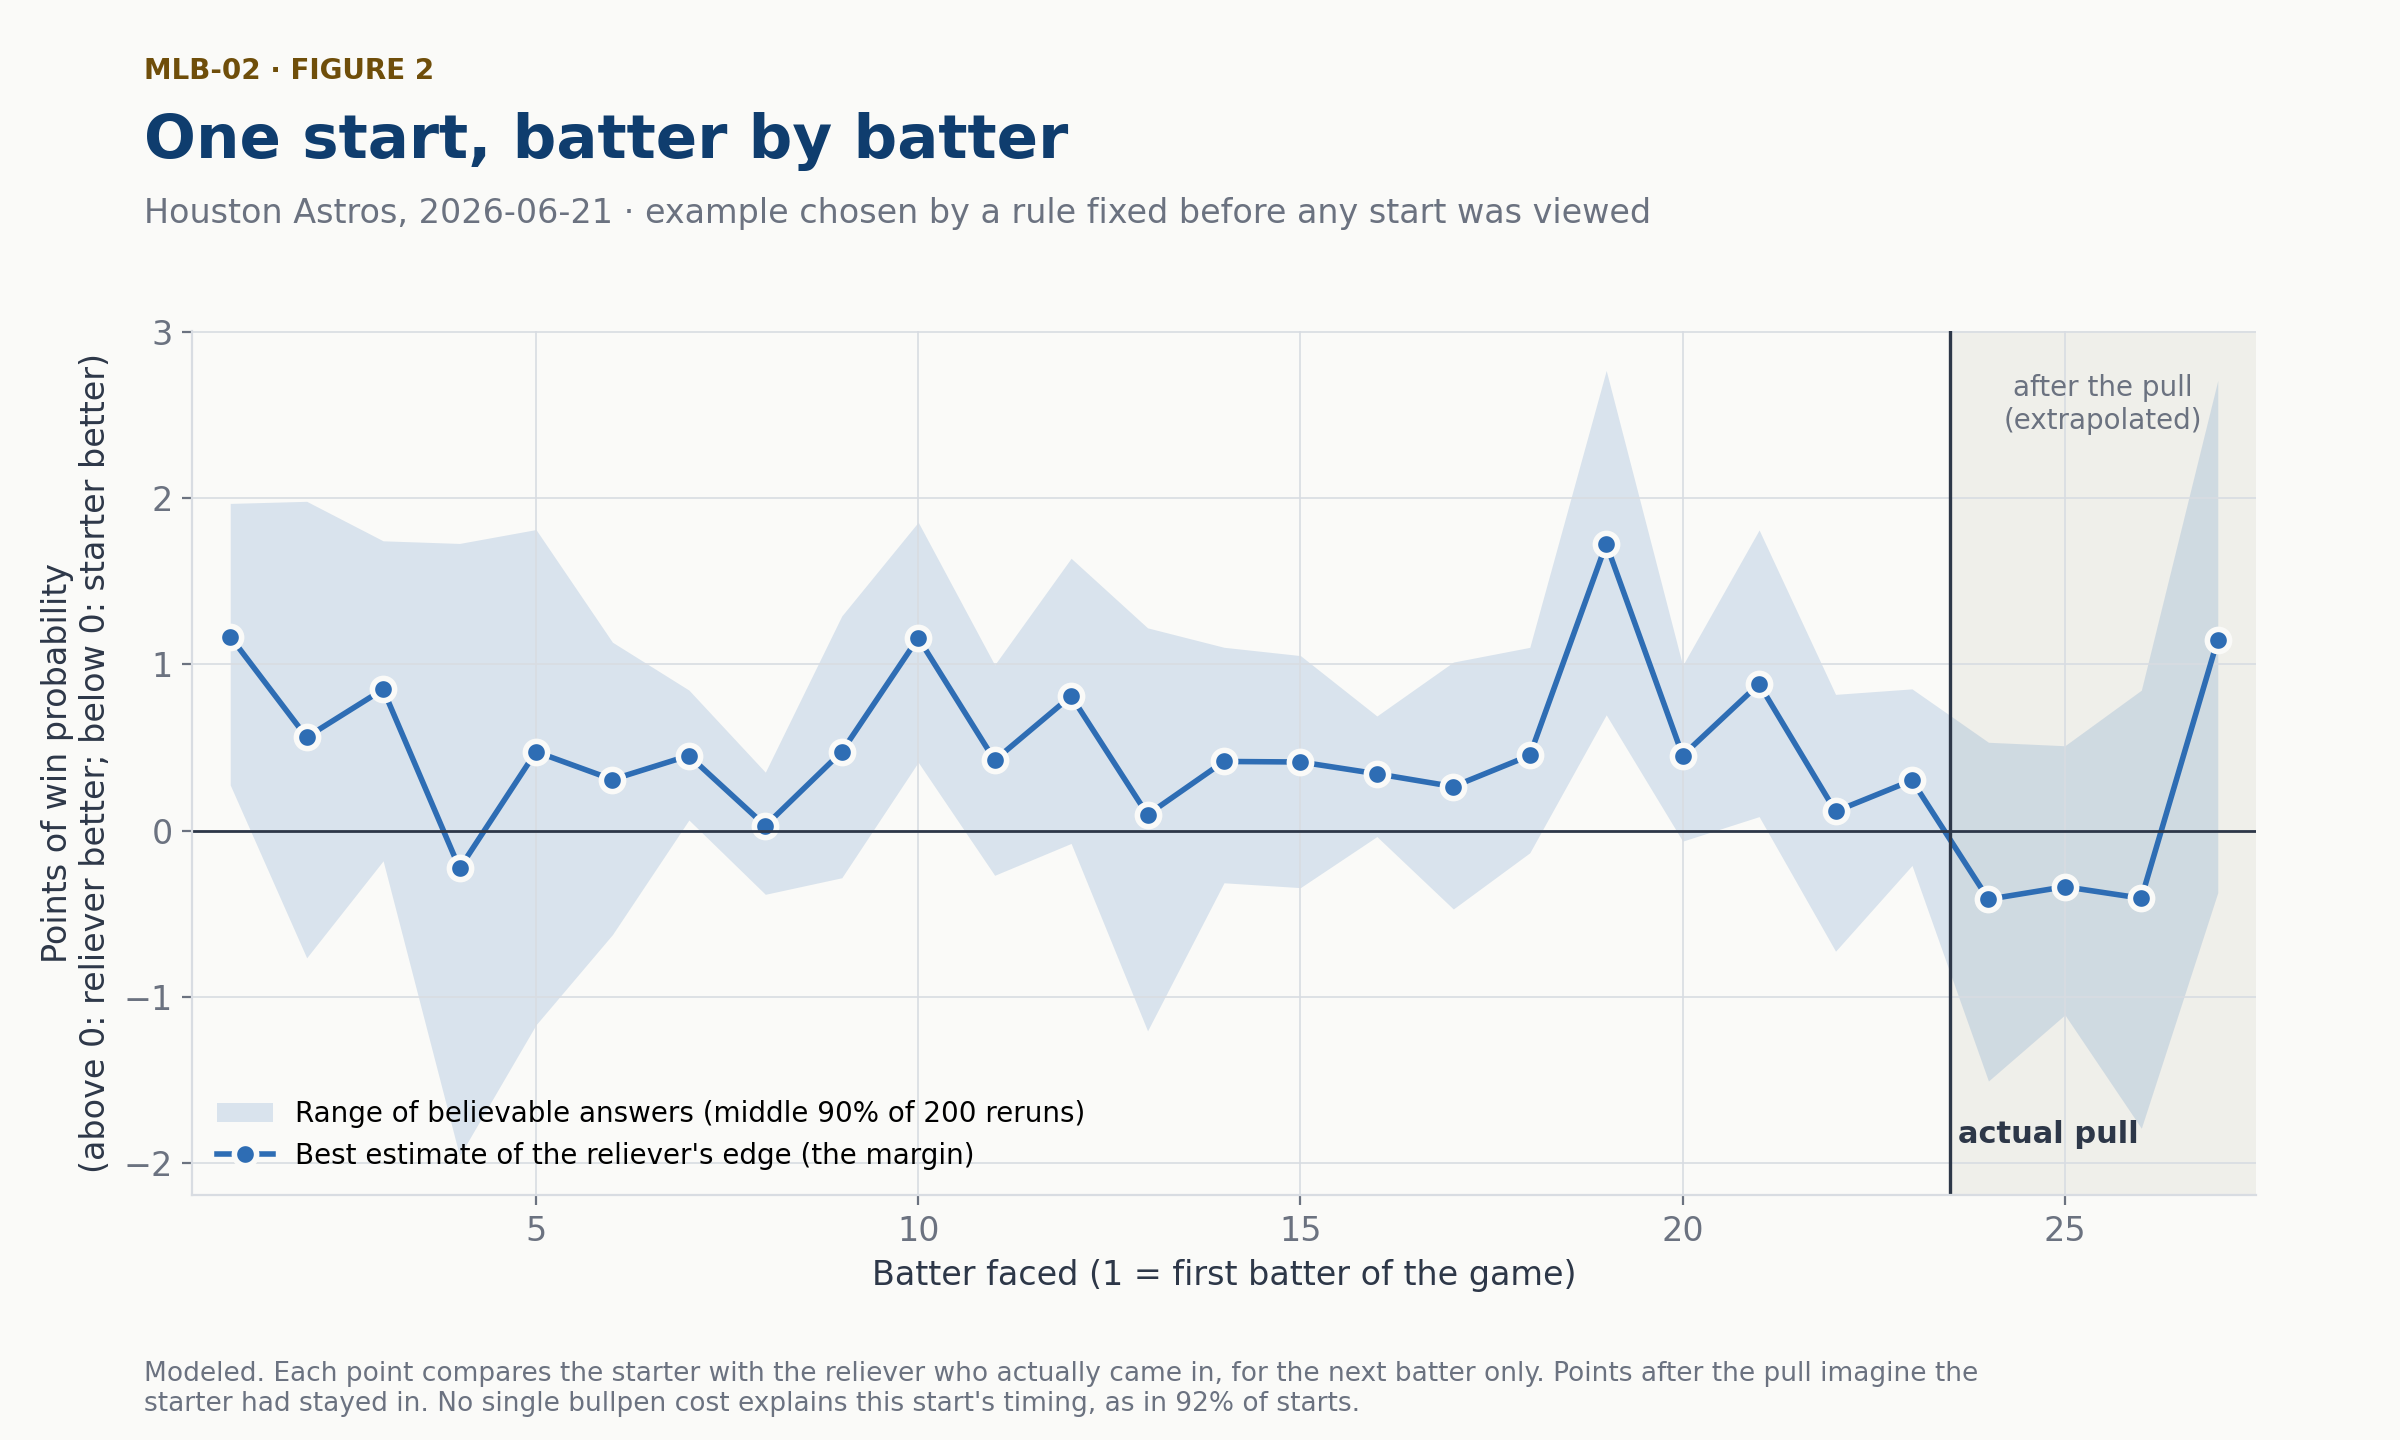
Figure 2 shows a single start, selected by a rule we fixed before looking at any individual game. In this Houston Astros start on June 21, the margin favored the reliever at 22 of the 23 batters the starter faced. Yet the uncertainty band included zero for 18 of those batters. The largest margin came at the 19th batter, at about 1.7 points, and the starter stayed in for four more hitters after it. For the batter the reliever actually faced first, the model slightly favored keeping the starter.
The pattern in this start repeats across the season. In our model, the reliever usually holds a small edge on the next batter, which is why so many margins sit just above zero. That small edge is exactly what the cost of using the bullpen must be weighed against. Because the margins swing with each hitter, the first moment a margin crosses any fixed cost often comes early and then disappears.
A hypothetical start shows why that matters. Imagine a manager who follows a simple rule: bring in the reliever as soon as his edge on the next hitter is larger than some fixed price for using the bullpen. Suppose the margins for four batters in a row are 0.1, 0.4, 0.2 and 0.3 points, and the manager pulls the starter before the fourth. Pulling at 0.3 fits the rule only if the price is 0.3 or less, but leaving the starter in at 0.4 fits only if the price is above 0.4. No single price explains both choices. For about 92 percent of real starts, the timing looked like this, with an earlier batter carrying a larger margin than the batter at the moment of the pull.
That does not mean the timing was random. As a check, we shuffled each pitcher's pull points among his own starts, keeping how deep he went in each game but scrambling which game each depth belonged to. Managers' actual timing fit a single price more often than the shuffled timing did, but only slightly. Whatever guides real pitching changes, it is not captured well by a fixed price applied one batter at a time.
A rule that looks only one batter ahead is a simplification. Managers think about the rest of the inning, who is warming up and which hitters are coming in the next frame. We checked our one-batter comparison against a version that let each pitcher finish the inning. The two agreed on whether to keep or pull the starter in about four of every five decisions. That level of agreement is a reason to read any single one-batter comparison with caution, and one more reason we do not grade individual choices.
What the League's Timing Implies
Individual decisions are too noisy to grade, but the season as a whole can still tell us something. For any assumed price of using the bullpen, we can mark each pull as too late or too early. A pull is too late when the starter stayed in for hitters against whom the reliever's edge was larger than the price, and too early when the reliever faced hitters against whom his edge was smaller than the price. Adding those margins across a season turns points into wins, because 100 points of win probability add up to one expected win. If using the bullpen were free, the model would have preferred earlier pulls, and as the assumed price rises, that preference shrinks and eventually reverses.
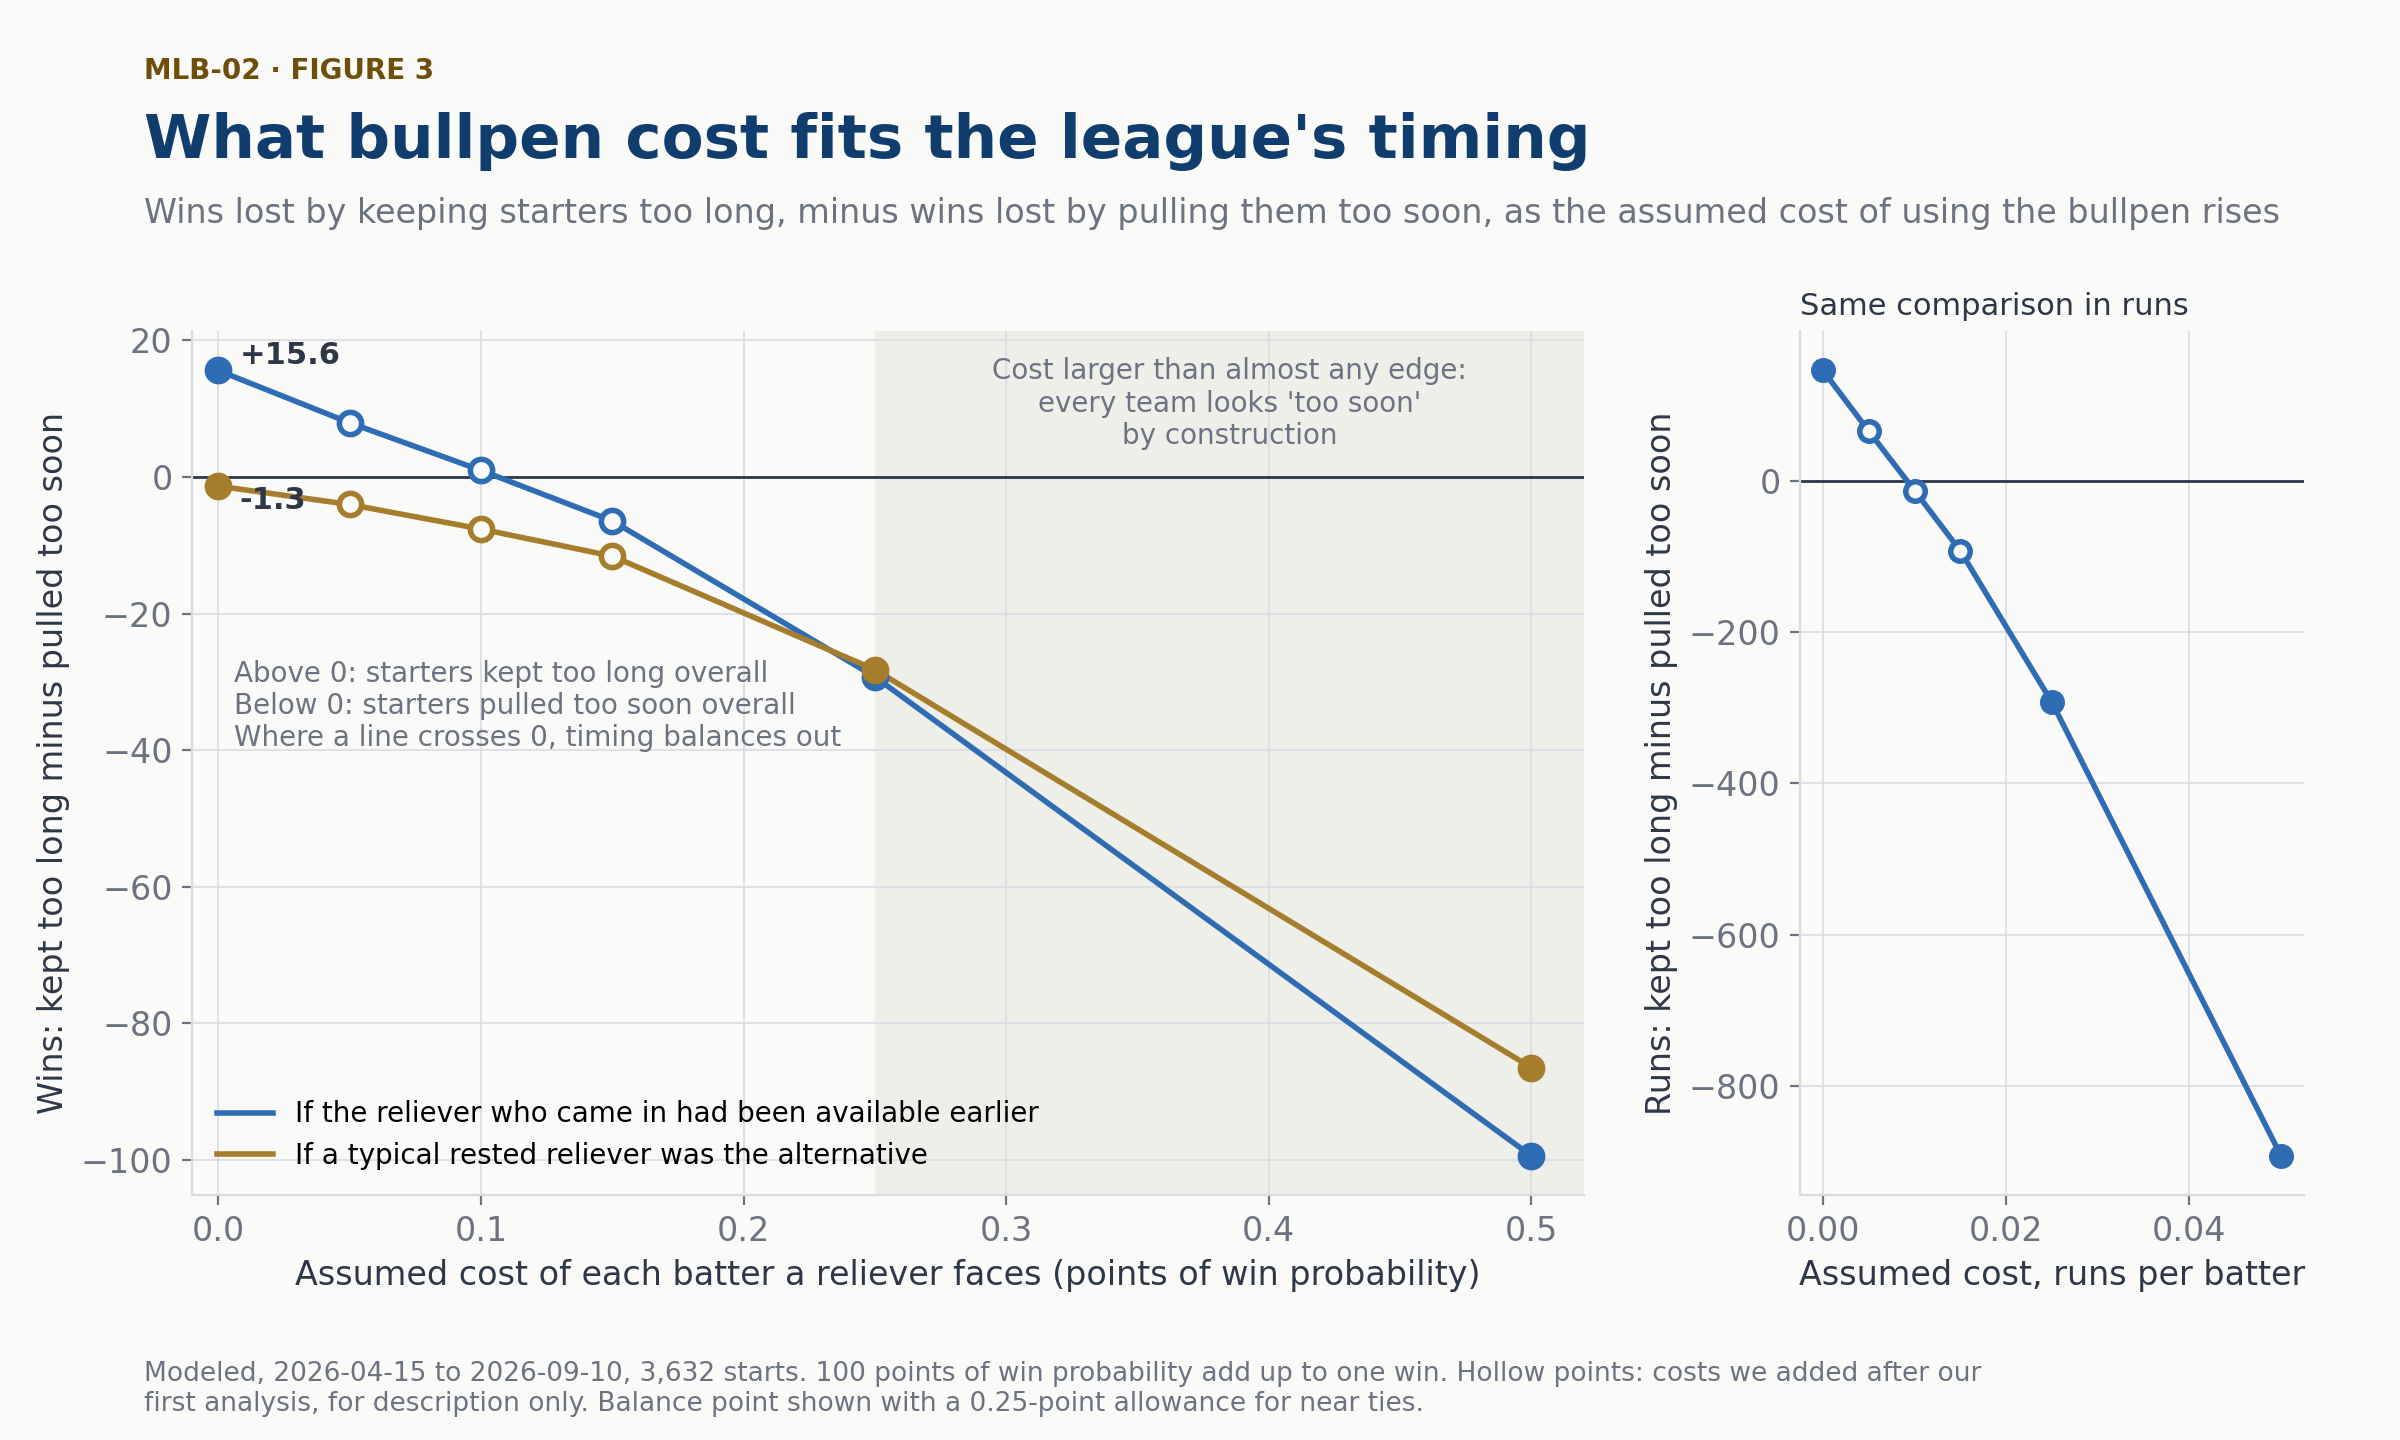
Under the assumption that the reliever who entered was available earlier, the league's aggregate timing is consistent with a bullpen cost of roughly 0.05 to 0.15 percentage points of win probability per batter. Where the balance point falls depends on how close a margin must be to count as a tie. With our 0.25-point allowance it falls between 0.10 and 0.15 points, and with an allowance of 0.1 points or less it falls between 0.05 and 0.10. In runs, under the published allowance, the crossing falls between 0.005 and 0.01 runs per batter. We located the crossing with cost values added after our first analysis run, so we treat it as a description of aggregate timing rather than a tested estimate. It is not a statement about what managers believe, and it is not a measurement of what a reliever is truly worth.
Who Was Warming Up?
One assumption shapes the verdict on pulling late more than any other. Our main comparison uses the reliever who actually came into the game as the alternative at every earlier batter. That reliever was the one the team chose for the moment the starter was finally removed. Treating him as available several batters earlier assumes the team could have used its chosen arm at any point, which may not have been true. Under that assumption and a free bullpen, managers left starters in long enough to cost about 16 modeled wins across the league.
When we replaced that reliever with the median rested arm in each team's bullpen, the picture changed. The same league total fell to about -1.3 modeled wins, which means no tendency to pull late at all. The gap between those two results is the gap between the reliever a team wished it had available and the one it actually had. A verdict that a team left a starter in too long therefore depends on two assumptions that rarely appear in the argument. Those assumptions are what the bullpen cost was and who could have pitched instead.
Beyond Baseball
The starter decision is a clean example of a problem every organization faces. A resource that has performed well begins to decline, and a fresh replacement is available but limited. Replacing too soon wastes the replacement and the remaining value of the original. Replacing too late lets the decline do damage that a fresh resource could have prevented. Project leads, operating teams and investment committees all make versions of this choice under uncertainty.
Three lessons carry over. First, price the decision before the outcome is known, because the outcome will always be more vivid than the reasoning. Second, make the cost of the replacement explicit, because the verdict on timing depends on it as much as on the decline itself. Third, when the difference between options sits inside the uncertainty, report the choice as too close to call rather than grading it by its result. A record that separates close decisions from clear ones shows where better information would pay off and where hesitation costs value.
The next time a reliever gives up a home run two pitches into his appearance, the useful question is not whether the change worked. It is what the margin was before the pitch, how wide the uncertainty around it was, and what it would have taken for the other choice to be better. For most moments in a baseball game, the answer is that the decision was closer than the argument suggests.
Methodology
Every estimate uses only information available before the game in question. The decisions span primary 2026 regular-season starts from April 15 through September 10, with September 11 through 27 held out for checks. Win probabilities are Pascal model estimates, and none of them uses the result of the batter being priced.
Correction, October 16, 2026. An earlier version of this article described all 99,072 comparisons as keep-or-pull moments, although 14,571 were extrapolations after a starter had left. Figure 1 and the shares now use the 84,501 observed moments. The earlier version also attributed the tie share to uncertainty without stating the 0.25-point allowance, said that who was due up mattered more than fatigue without measuring it, and described the league's timing as if it revealed what managers believe. Those passages are corrected, the implied bullpen cost is now a range that depends on the allowance, and the methodology adds a post-publication review and a replication bundle.
References and prior work
- Pascal Institute: Brandon Pfaadt, When the Outcome Hides the Process
- Pascal Institute: Pricing an ABS Challenge
- Pascal Institute: Not All Field Goals Weigh the Same
- Tom Tango, Mitchel Lichtman and Andrew Dolphin, The Book: Playing the Percentages in Baseball (Potomac Books, 2007).
- Mitchel Lichtman, “The penalty for pitchers going through the batting order,” Baseball Prospectus, November 5, 2013, reprinted by SABR.
- Ryan S. Brill, Sameer K. Deshpande and Abraham J. Wyner, “A Bayesian analysis of the time through the order penalty in baseball,” Journal of Quantitative Analysis in Sports 19, no. 4 (2023): 245-262.
- Ben Lindbergh, “MLB Doesn’t Have Much Appetite for Innings Eaters Anymore,” The Ringer, January 16, 2024.
- MLB Stats API game feeds, 2026 regular season.