
Milwaukee led the National League Championship Series one game to none. In Game 2, the score was tied 4-4 in the bottom of the sixth inning. There was one out, and David Hamilton stood on third base, ninety feet from giving the Brewers the lead. Brice Turang, a left-handed hitter batting second, stepped in against Dodgers right-hander Brock Stewart. The Dodgers signaled for the intentional walk, Turang went to first base, and William Contreras, a right-handed hitter batting third, came to the plate.1
It is one of the most familiar decisions in baseball, and one of the quietest. There is no swing, no throw, and no play to replay. Because nothing visibly happens, the walk is rarely examined as closely as a bunt or a pitching change. Yet it changes the inning as surely as either of them.
The decision had a backdrop that no one watching would have missed. Contreras had homered one inning earlier, in the bottom of the fifth, after a single in the first and an out in the third. On the surface, putting another runner on base to face the hitter who had just cleared the fence seemed backward. That home run deserves attention, but perhaps not the kind it received. When we looked at the 2026 regular season, hitters who had already homered in a game hit about as usual the rest of the way, relative to other later at-bats.2 Home runs were within the noise, about 5 percent higher with a range from 7 percent lower to 16 percent higher, and hits and strikeouts were essentially unchanged. That check is exploratory, and it describes the league rather than Contreras himself. An earlier home run added little to what a full season of at-bats already said about a hitter, so our analysis does not use it.
What a Walk Gives, and What It Takes
To understand the decision, it helps to set aside the players and look only at the situation. A runner on third with one out is one of the most dangerous positions a defense can face. Almost any fly ball or slow roller scores the runner. A strikeout is the defense's best escape. The intentional walk changes that picture in two ways: it creates a force at second and the chance of an inning-ending double play, and it adds a second runner who can score on every hit that follows.
Across the 2026 regular season, through Sept. 27, 2026, teams with a runner on third and one out scored at least once 65.3 percent of the time. With runners on first and third and one out, they scored at least once 64.2 percent of the time. But they scored two or more runs 16.7 percent of the time from the first situation, and 27.9 percent of the time from the second.3 These are league-wide rates, built from every hitter and pitcher in those situations, before any individual talent is considered.
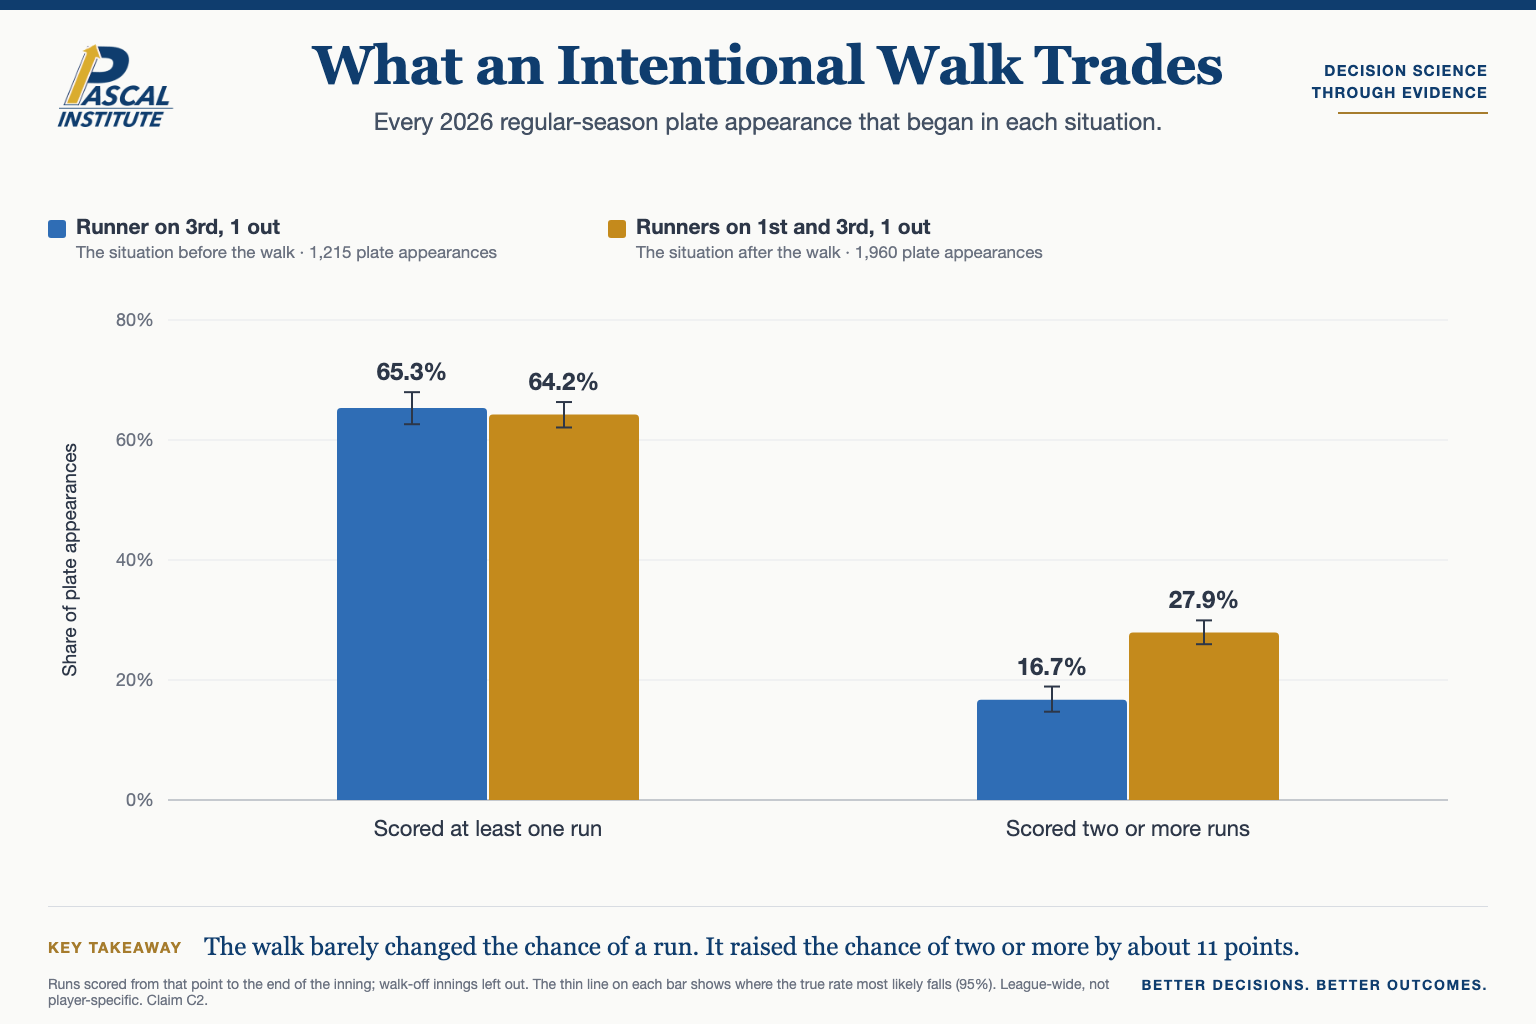
That is the trade in its simplest form. The walk barely moves the chance that a run scores at all. What it does change, and change substantially, is the chance that the inning gets away. The defense gains almost nothing on the first run and accepts a much larger risk on the second and third.
Why the Second Run Matters in the Sixth
In the bottom of the ninth inning, the walk has a clear logic. If the home team scores a single run, the game is over, and a second or third run is meaningless. The defense can afford to trade a bigger inning for any small edge on the first run, because there is no bigger inning to worry about.
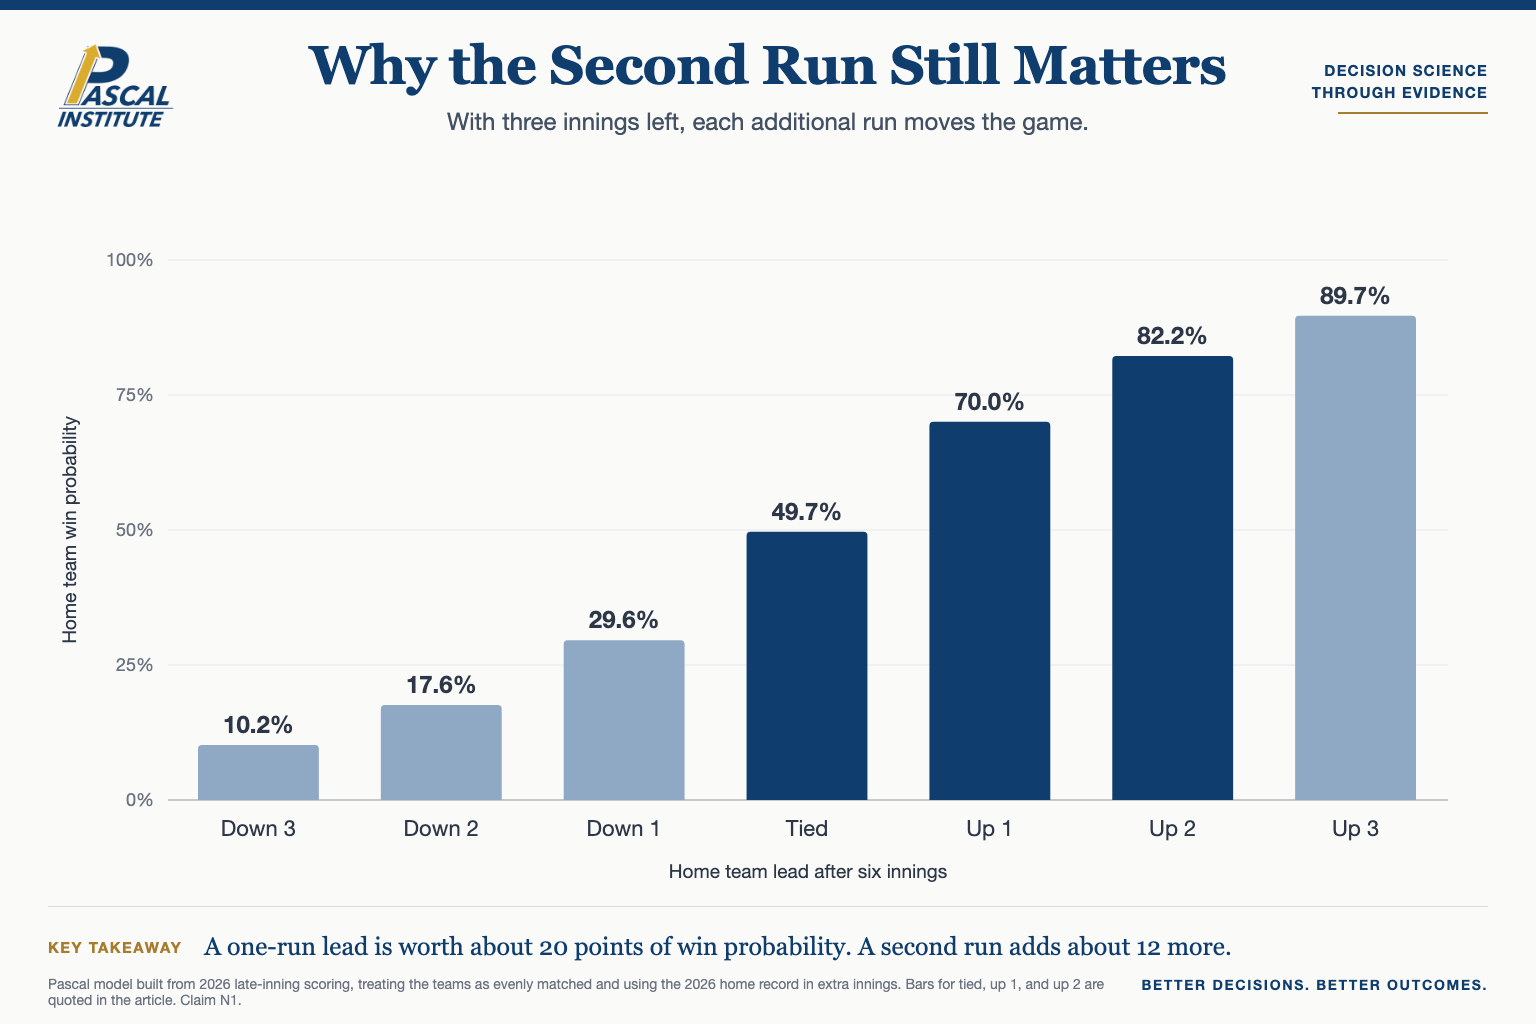
The sixth inning is different. Three innings remained, and the Dodgers would have time to answer one run, while answering two or three is a much taller task. To measure that, we use win probability: the share of games a team in a given situation goes on to win. A change of one point is one percentage point of that share, or roughly one more win in every hundred games played from the same spot. Under our model, which treats the two teams as evenly matched, a game tied after six innings is won by the home team about half the time; a one-run lead raises that to about 70 percent, and a two-run lead to about 82 percent.4
The first run matters a great deal, and the second run matters nearly as much. When we converted the league scoring rates into win probability, the walk came out behind, costing the Dodgers about 2 percentage points. That figure, like every model estimate that follows, is post-hoc, which means we settled on the method after seeing our first results; the box below explains why. Before anyone knew who was batting, the situation already leaned against it.
The Hitters in Front of Them
The league numbers blend every hitter and pitcher who faced that situation in 2026. A real decision is never that general. The Dodgers were choosing between pitching to Turang and pitching to Contreras, with Stewart on the mound, so the real question is whether the skills of those three players change the answer. Our model suggests they do not. With a runner on third and fewer than two outs, the outcome a pitcher most wants is a strikeout, because a ball in play so often scores the run. Against Stewart, our post-hoc model put Contreras's strikeout chance at about 18 percent and Turang's at about 24 percent. In our model, Turang was the hitter more likely to give Stewart the out he needed, and the walk replaced him with a hitter more likely to put the ball in play while placing a second runner on base.
When we modeled the rest of the inning with the actual Milwaukee lineup and Stewart on the mound, the result held. Our model is anchored to 2026 league scoring rates, which means it starts from how often teams actually scored in each situation and adjusts only for these hitters and this pitcher. By that post-hoc model, walking Turang lowered the Dodgers' chances from about 34 percent to 32 percent, a 2.2-point cost, disfavored, clear, and stable across every alternative assumption we tested. Before the study, we defined a clear result as a cost of at least one point, and a stable one as a cost that points the same way under every assumption we try. In our model, the walk left Milwaukee's chance of scoring about where it was, but raised its chance of two or more runs from about 18 percent to 28 percent. No alternative assumption we tested moved the cost outside 2.1 to 2.3 points. When we reran the analysis on hundreds of reshuffled versions of the season, to see how much the luck of the schedule alone could move it, the cost stayed between about 1.1 and 3.3 points.5
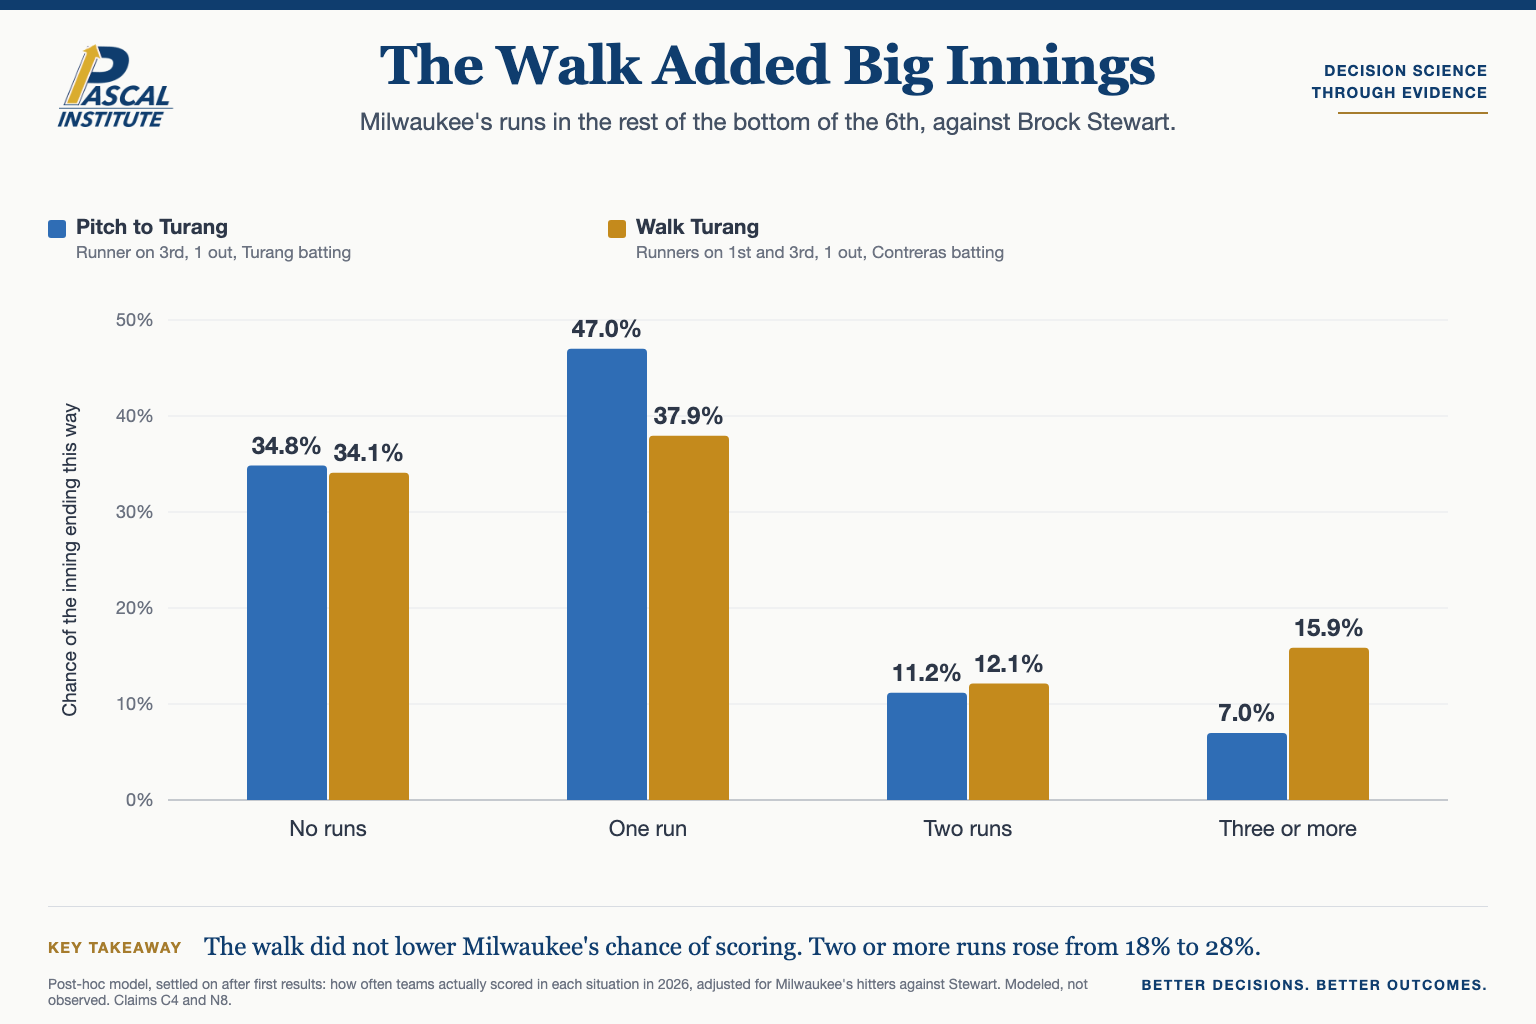
Two points may not sound like much, but in a seven-game series small edges are often the only kind available. There are also things the model could not see. Turang is fast, and a quick runner at first base makes a double play harder to turn. The model includes the handedness of each matchup, but not runner speed, infield positioning, or the state of the Dodgers' bullpen. Stewart had 101 regular-season plate appearances in our sample, so the model treats him as close to league average. Each is a reason for humility about the precise number.
Judging the Decision, Not the Result
By now, many readers already know what Contreras did with his at-bat. We have deliberately left it out. The result matters, but it is the one piece of information the Dodgers could not have had when they made the call. This is the same problem we explored in "Not All Field Goals Weigh the Same."7 A decision is made with the information available at the moment, and the result arrives afterward, carrying all the force of something that actually happened.
If Contreras made an out, the walk will be remembered as a smart move. If he drove in runs, it will be remembered as a mistake. Neither memory says anything about whether the decision was sound when it was made. The same pattern appears far from the ballpark. A business that avoids one visible risk by accepting a less visible one can look prudent for a long time, until the less visible risk arrives.
The intentional walk is a useful illustration because both risks sit side by side on the same base paths. The walk removed a hitter, and it also added a runner. Judged only by what was knowable before it happened, the Turang walk cost the Dodgers about two points of win probability under our model. That does not tell us how the inning ended. It tells us how the inning was priced.
Readers who want to test their own calls the same way can use AnalytIQ's Decision Journal, which records a decision before the result is known and brings it back once the outcome arrives.
Notes
- MLB Stats API, NLCS Game 2 live game feed, Los Angeles Dodgers at Milwaukee Brewers, Oct. 12, 2026. The decision state uses only plays before the walk.
- Pascal Institute research, exploratory check of hitters after an earlier home run in the same game, 2026 regular season. See the methodology page.
- Pascal Institute research, how often teams scored from each combination of bases and outs, from MLB Stats API game feeds for the 2026 regular season.
- Pascal Institute research, win probability by lead after six innings. See the methodology page.
- Pascal Institute research, matchup model anchored to league rates, with alternative assumptions and reruns on reshuffled seasons. See the methodology page.
- Pascal Institute, methodology for "What the Turang Walk Traded".
- Pascal Institute, "Not All Field Goals Weigh the Same".