
Late in a start, as a manager walks to the mound, the broadcast booth often reaches for the same explanation: the starter is about to face the lineup a third time. Behind that line is one of baseball's best-known patterns, the times-through-the-order penalty, which means that hitters tend to do better each time they see the same starting pitcher in a game. From 2023 to 2026, about 86% of starts reached a third time through the lineup, and about 5% a fourth, so the third trip is a question nearly every team faces nearly every night.1 We wanted to know how large the penalty is at each trip, and whether it builds steadily as the pitcher throws more pitches or arrives in jumps when the lineup turns over.
How Big the Penalty Is
We studied 374,503 plate appearances by starting pitchers in 16,909 starts, using the 2023-2026 regular seasons, April 15 onward.1 A plate appearance is one batter's complete turn at bat, and we scored each one by its run value, which is the average change in the runs a team can expect to score in the rest of the inning given the bases, the outs and the result. We then adjusted for the quality of each hitter and each pitcher, so that a trip is never compared with another trip that happened to face a weaker part of the order. One more correction matters. Starters who struggle early are more likely to be removed before a third trip, so the pitchers who remain are, on average, the ones having better days, and a raw comparison would understate the penalty. We corrected for which starters get to go deeper, and the methodology page shows that the corrected estimate sits between two simpler ones known to lean in opposite directions.
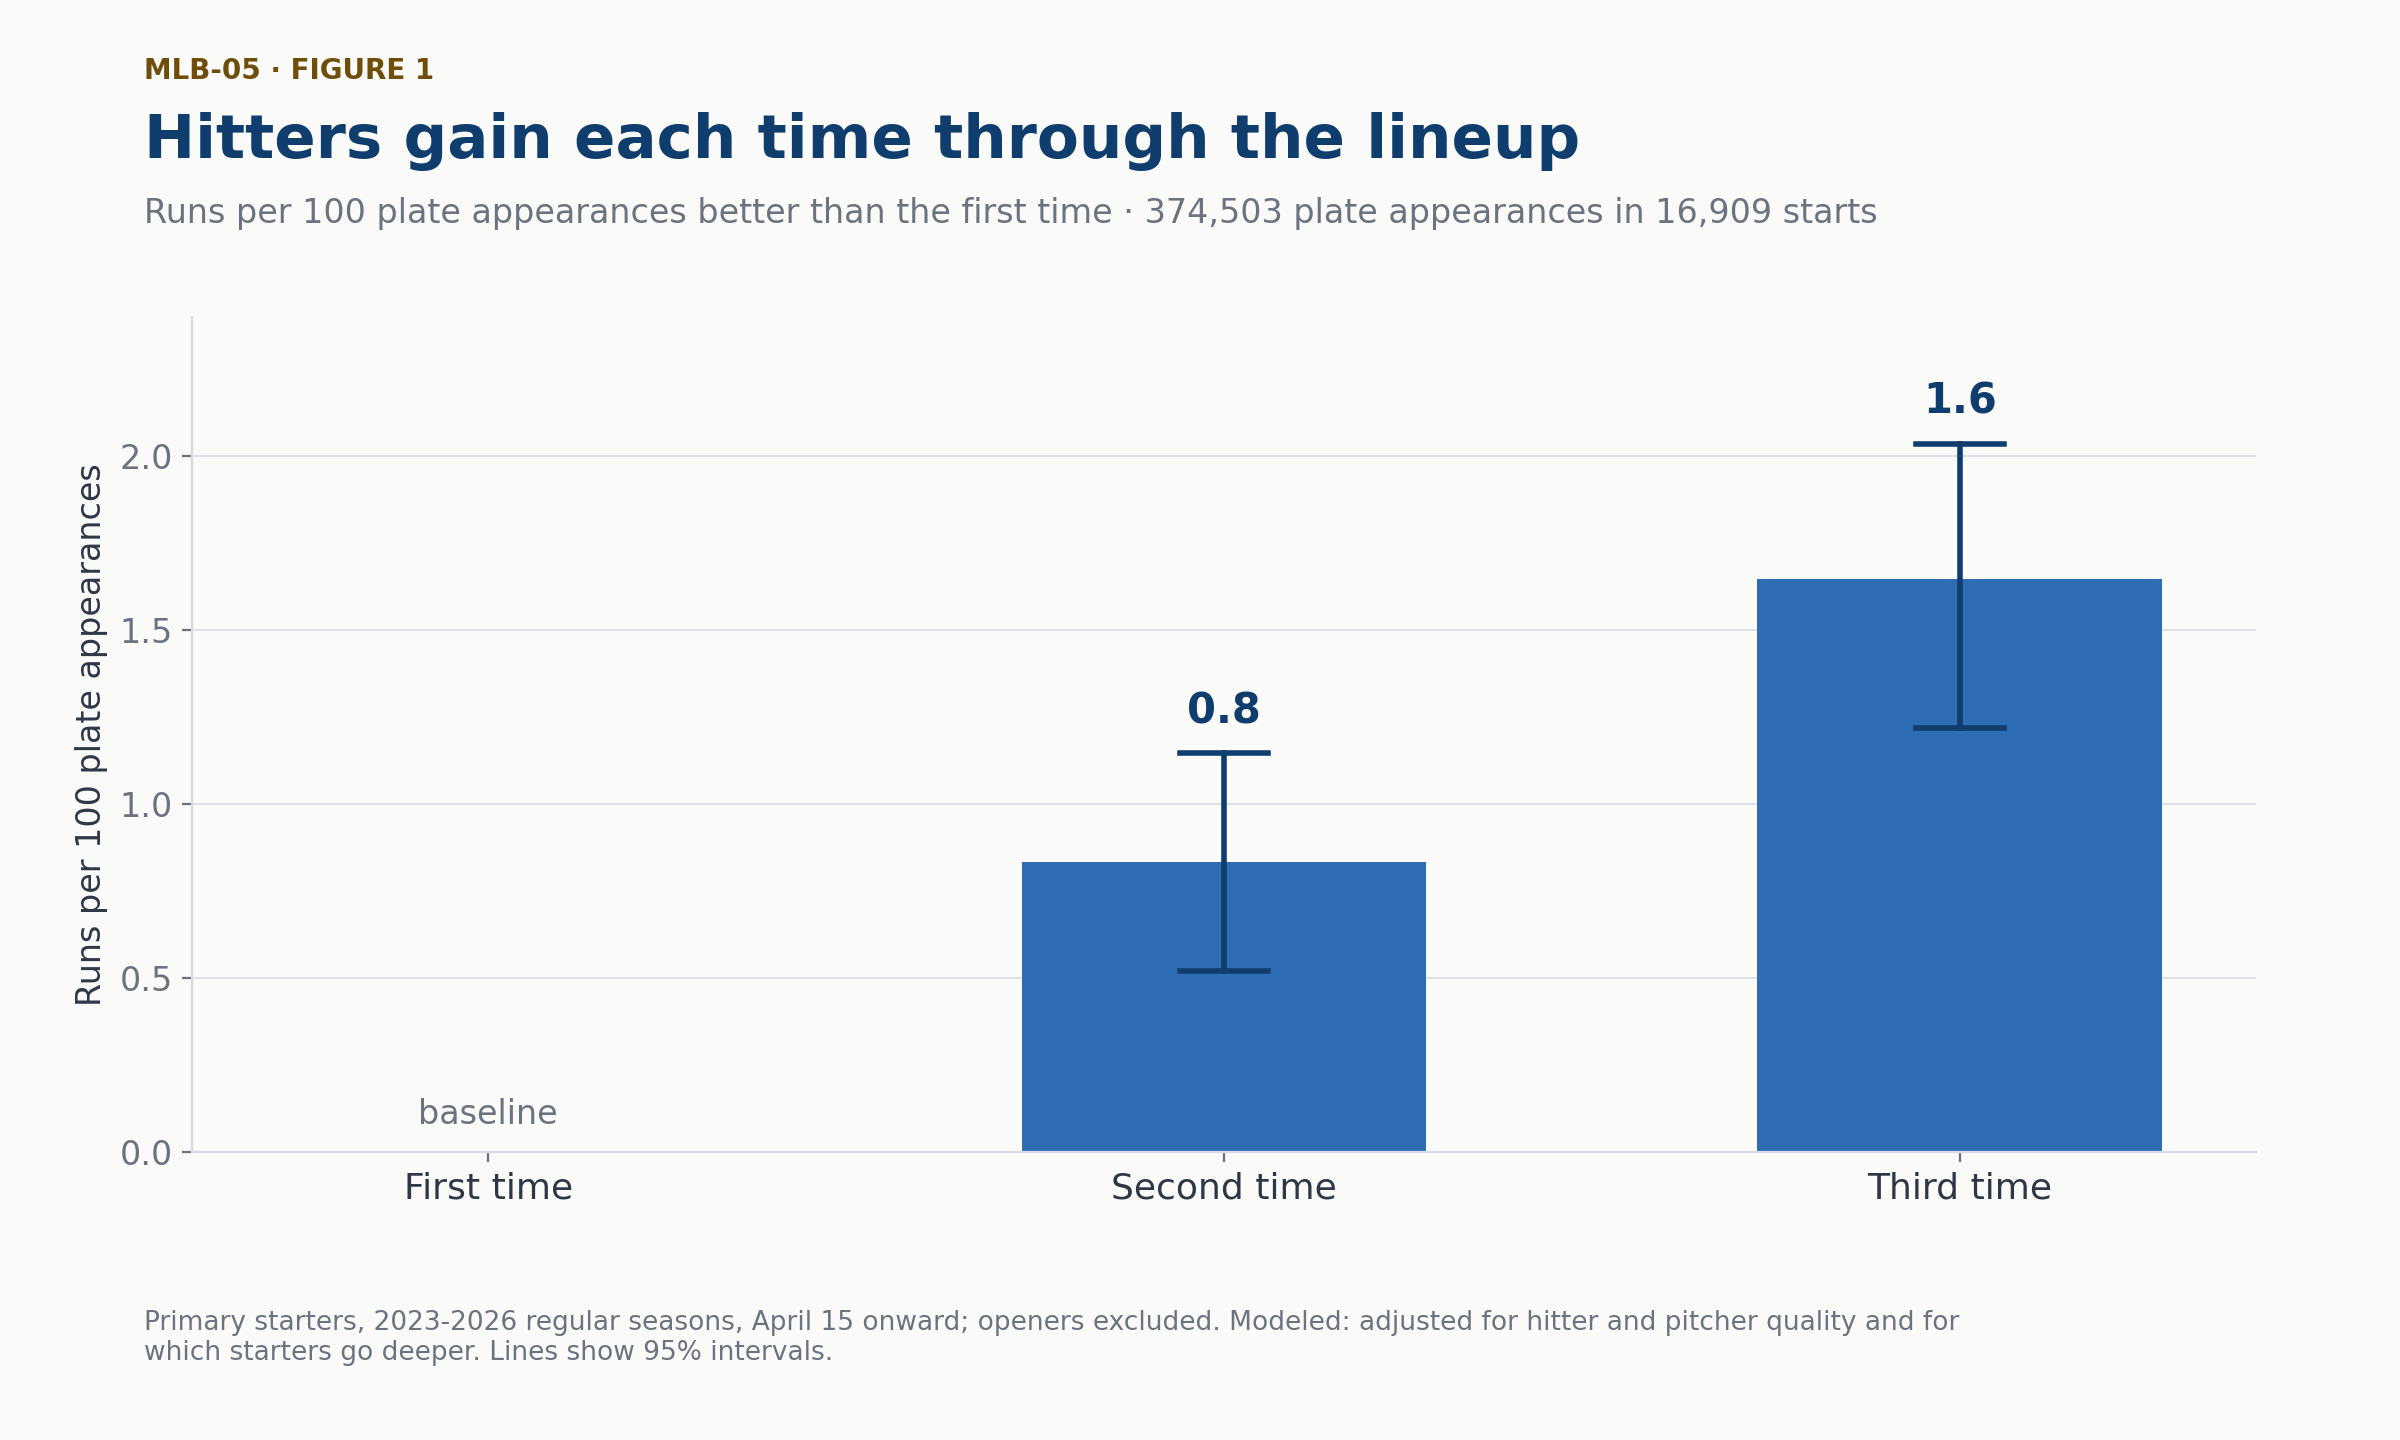
Under our models, hitters did about 0.8 runs per 100 plate appearances better the second time they faced a starter than the first, and about 0.8 better again the third time.1 By the third time through the lineup, hitters did about 1.6 runs per 100 plate appearances better than the first time, with a 95 percent interval of 1.2 to 2.0. That interval is the range of values our data support under our models. One way to size the number is to multiply it by the roughly 38 batters a starter would face over nine innings, which gives about six-tenths of a run per nine innings. That is a way to picture the gain, not a forecast for any game or any pitcher.
A Jump, Not a Slide
The harder question is where the penalty comes from. Trip number and pitch count rise together, because a pitcher facing the order a third time has also thrown more pitches. A single season cannot pull those two apart, which is why "When to Pull the Starter" reported one number for the third time through and did not try to split it.2 With four seasons, we could compare hitters at the same pitch count on either side of the moment the lineup turned over. Holding pitch count fixed, hitters' gain shows up as a jump when the lineup turns over for the second and third time, not as a steady rise with the pitch count.1
That finding is narrower than it may sound. It says where the gain appears, not why, and we make no claim about what hitters or pitchers are thinking or feeling. The split between a jump and a slide also passed its stability test, which we wrote down before looking at any results, by a very small margin, and the size of each jump depends on the model, so we do not report one. Our result also disagrees with a 2023 study by Brill, Deshpande and Wyner, which found that performance declines gradually with little sign of a jump between trips.3 We used different methods, and we report the disagreement rather than claim to settle it.
Steady From Season to Season
The penalty was similar in each season from 2023 to 2026, and we see no change in 2026, the first season of the ABS challenge system.1 That does not show that the challenge system left pitchers untouched. It shows only that this one pattern did not move. The 2026 estimate also matches the one we published in "When to Pull the Starter," now with three more seasons behind it and a correction for which starters get to go deeper.2
What It Means for the Decision
None of this says when a manager should pull a starter. In "When to Pull the Starter," we found that most keep-or-pull moments in 2026 were too close to call once the uncertainty about each player's talent was counted.2 The times-through-the-order penalty is one input to that decision, alongside the hitters coming up, how the starter is throwing that day, and what the bullpen can offer. What this study adds is the shape of that input: it arrives in steps as the lineup turns over, and its size held steady for four seasons. It does not make the third time through a cutoff, and a jump at the turnover is a reason to look harder at that moment, not a rule for what to do in it.
Notes
- Pascal Institute analysis of Baseball Savant Statcast pitch data and MLB Stats API game data, 2023-2026 regular seasons, April 15 onward; primary starters only, openers excluded. Methods, intervals and limitations are on the methodology page.
- Pascal Institute, "When to Pull the Starter".
- Brill, Deshpande and Wyner, "A Bayesian analysis of the time through the order penalty in baseball", Journal of Quantitative Analysis in Sports, 2023.