
The ABS Challenge System gives hitters a way to correct an umpire’s mistake. It also asks them to make a fast decision with incomplete information and a scarce resource.
In the first article in this series, we asked how often hitters challenged an estimated incorrect called strike. Using a public-data reconstruction that agreed with 9,482 of 9,485 official ABS decisions, we found 10,755 legal opportunities through September 9. Hitters challenged 2,112: 19.64 percent, or roughly one in five.
That result led to a different question. Why those 2,112? What separates a call a hitter challenges from one he allows to stand?
Four Outcomes, One Decision
Article 1 concentrated on estimated incorrect calls. That was the right population for measuring how frequently hitters corrected mistakes, but it captured only one side of the decision. When an umpire calls a strike, the hitter does not yet know what ABS will say.
For this analysis, we expanded the descriptive population to every classifiable called strike where the hitter legally could have challenged: 96,486 opportunities and four possible outcomes.
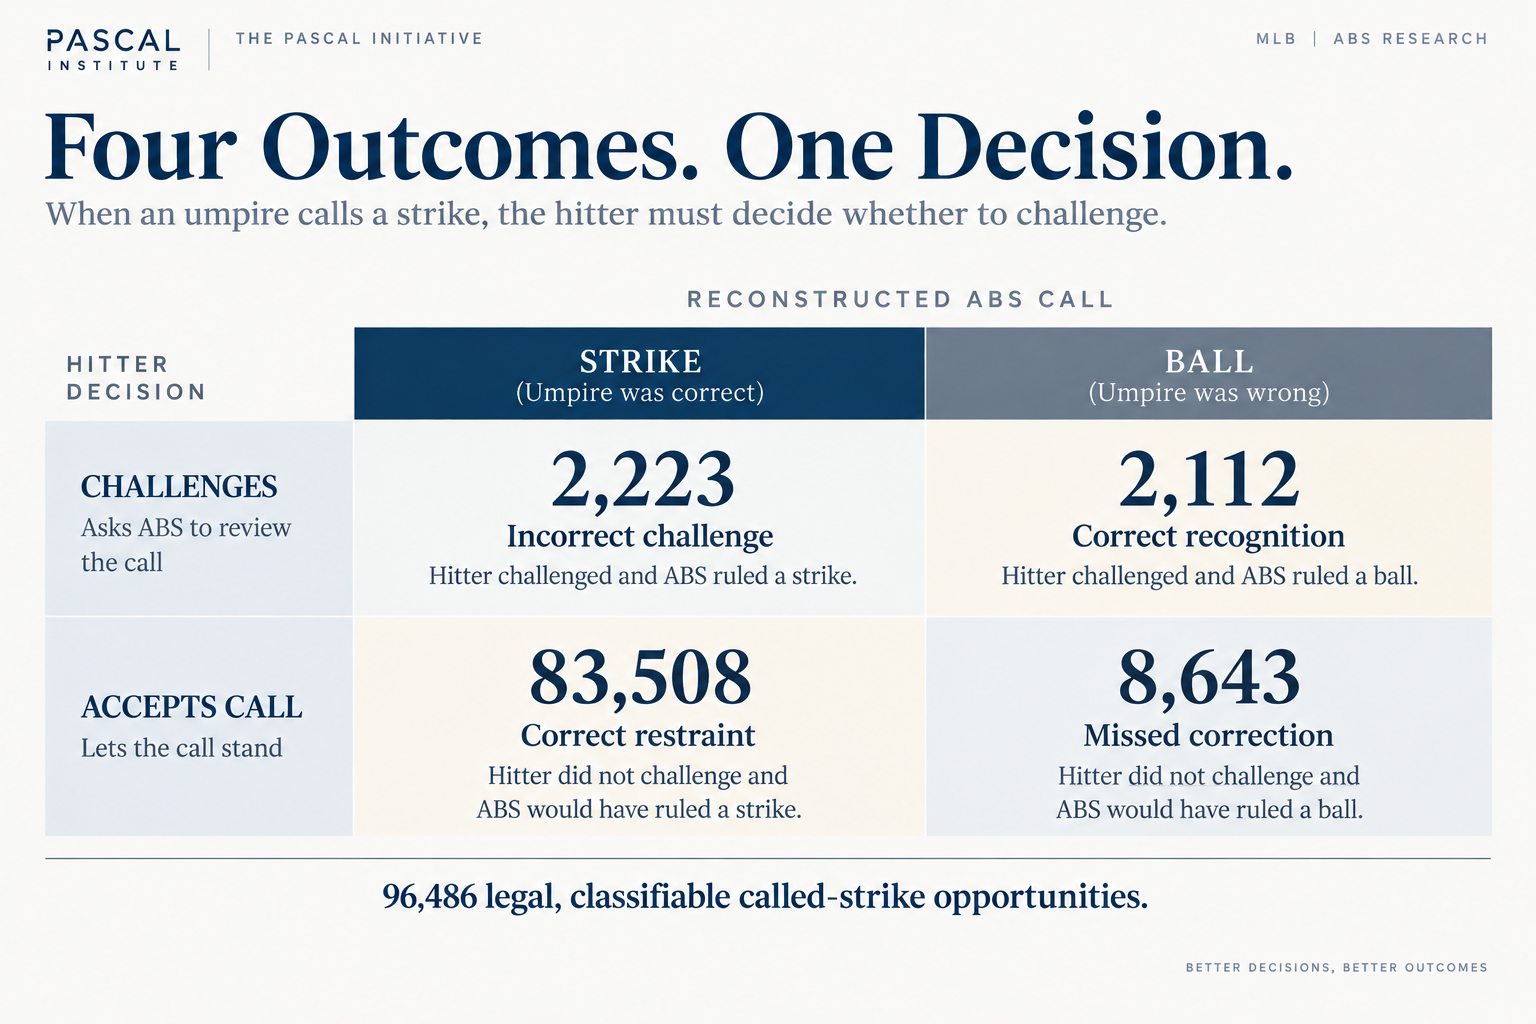
Among the 10,755 calls our reconstruction identified as incorrect, hitters challenged 2,112 and allowed 8,643 to stand. Among 85,731 calls classified as correct, hitters challenged only 2,223, or 2.59 percent.
Hitters are not challenging indiscriminately. They are generally reluctant to challenge at all. Most called strikes are accepted, including most incorrect ones. The useful question is what changes when a hitter moves from accepting the umpire’s judgment to asking ABS to review it.
The Boundary Is Sharp. Behavior Is Not.
Pitch location is the obvious place to begin. For every opportunity, we measured the pitch’s signed distance from the reconstructed ABS boundary. Negative values represent pitches inside the zone; positive values represent pitches outside it.
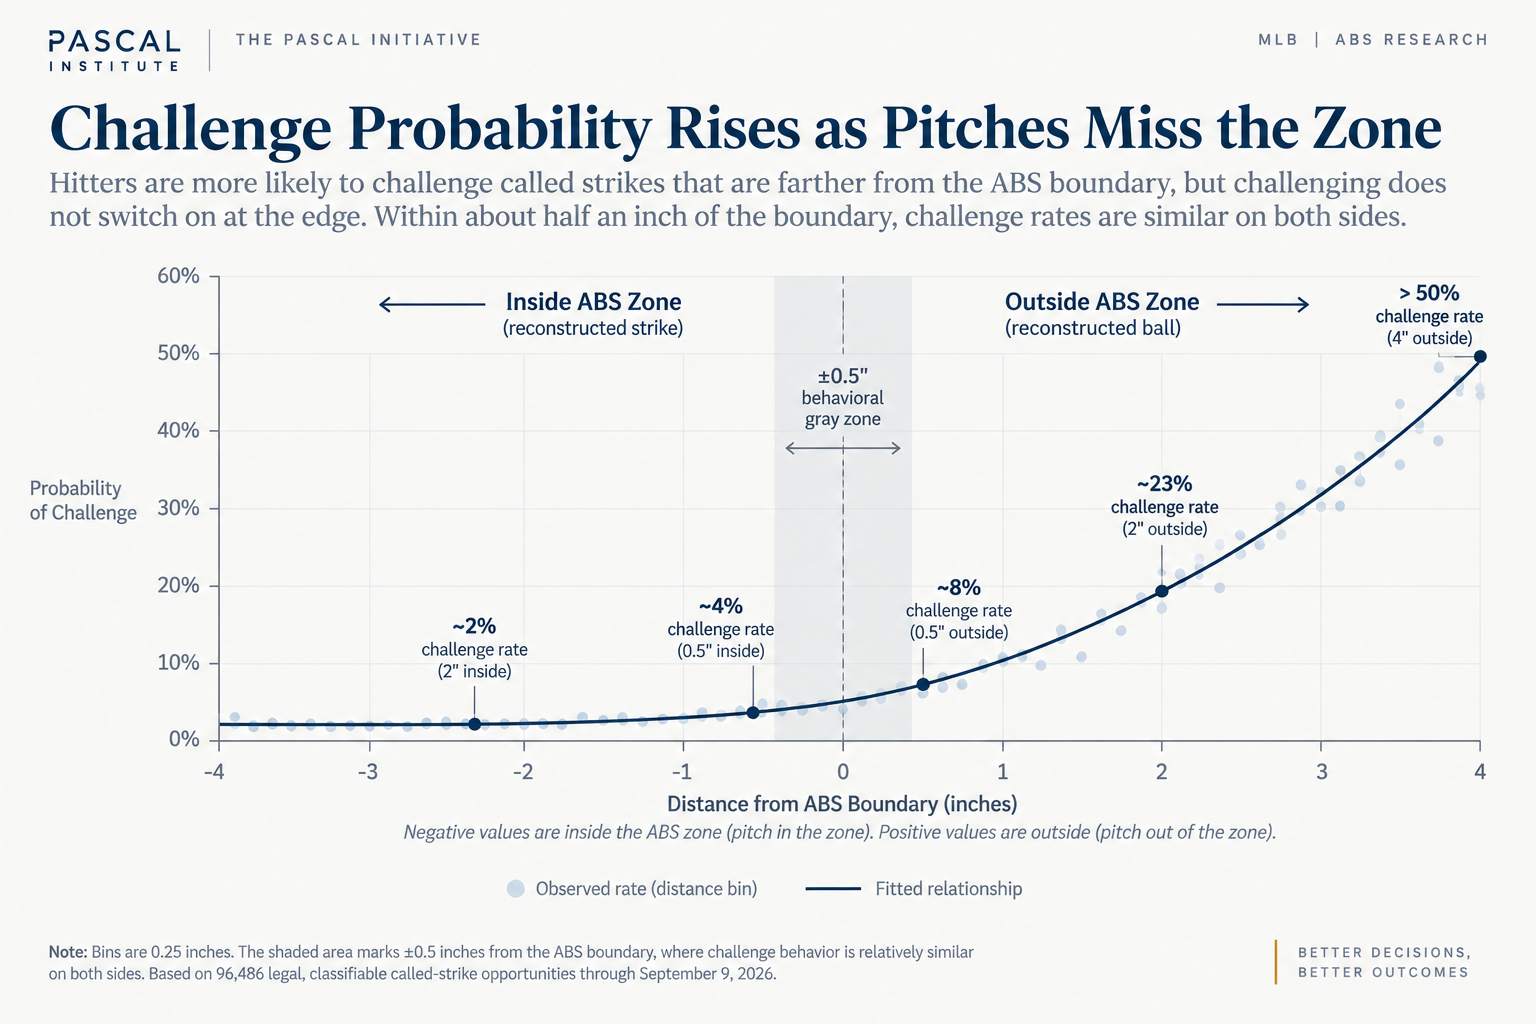
As a pitch moves farther outside the zone, hitters become increasingly likely to challenge. The more interesting behavior occurs near the boundary itself, where challenge probability does not suddenly jump when the technological classification changes from strike to ball. Within about half an inch on either side, challenge behavior remains relatively similar. We describe this cautiously as a behavioral gray zone.
This is not a measure of eyesight. We cannot observe what the hitter saw, how confident he was, or what other information affected the decision. The pattern could reflect perception, expectations, strategy, or several factors working together. What we can say is that the technological boundary is much sharper than the behavioral boundary reflected in hitter challenges.
Many Mistakes Are Not Borderline
If most disagreements occurred within that narrow band, the explanation would be straightforward. The data show that they extend considerably farther.
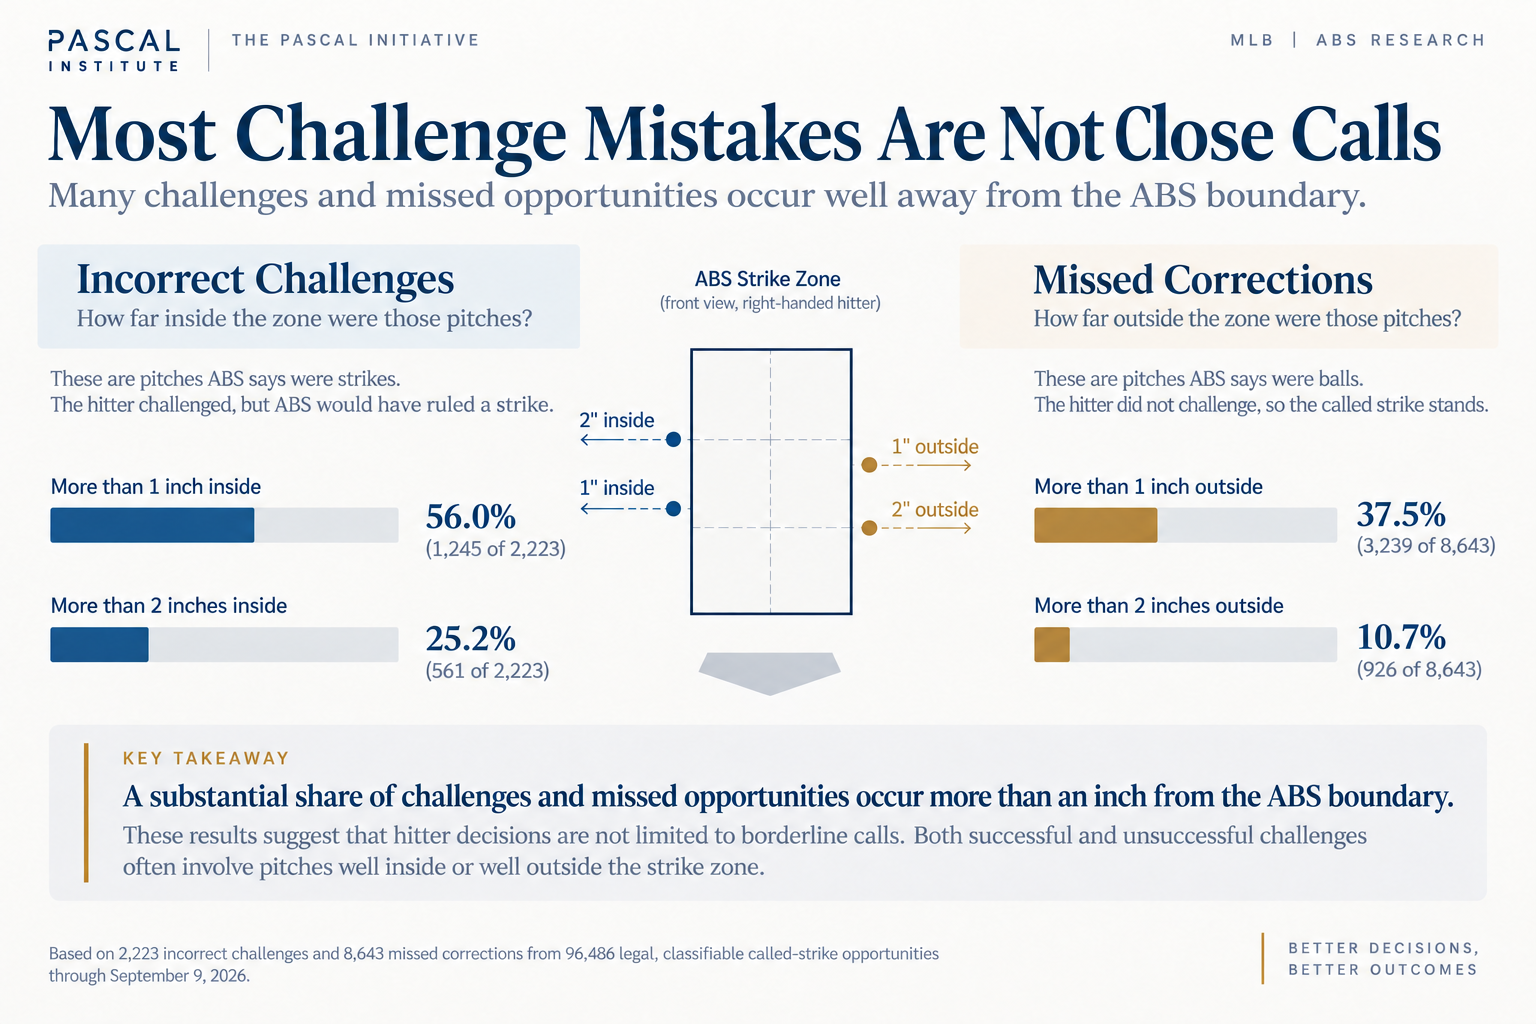
More than half of incorrect challenges occurred on pitches more than one inch inside the reconstructed zone, and more than a quarter were over two inches inside. The opposite error also occurred well beyond the edge: 37.5 percent of missed corrections were over an inch outside, and 10.7 percent were over two inches outside.
Distance is important, but it is not a complete explanation. Hitters sometimes challenge pitches meaningfully inside the zone and accept pitches meaningfully outside it. Something besides physical distance affects their willingness to act.
Low Pitches Draw More Challenges
Distance alone misses another part of the geometry. Hitters do not treat every boundary of the strike zone in the same way. The strongest directional difference appears at the bottom.
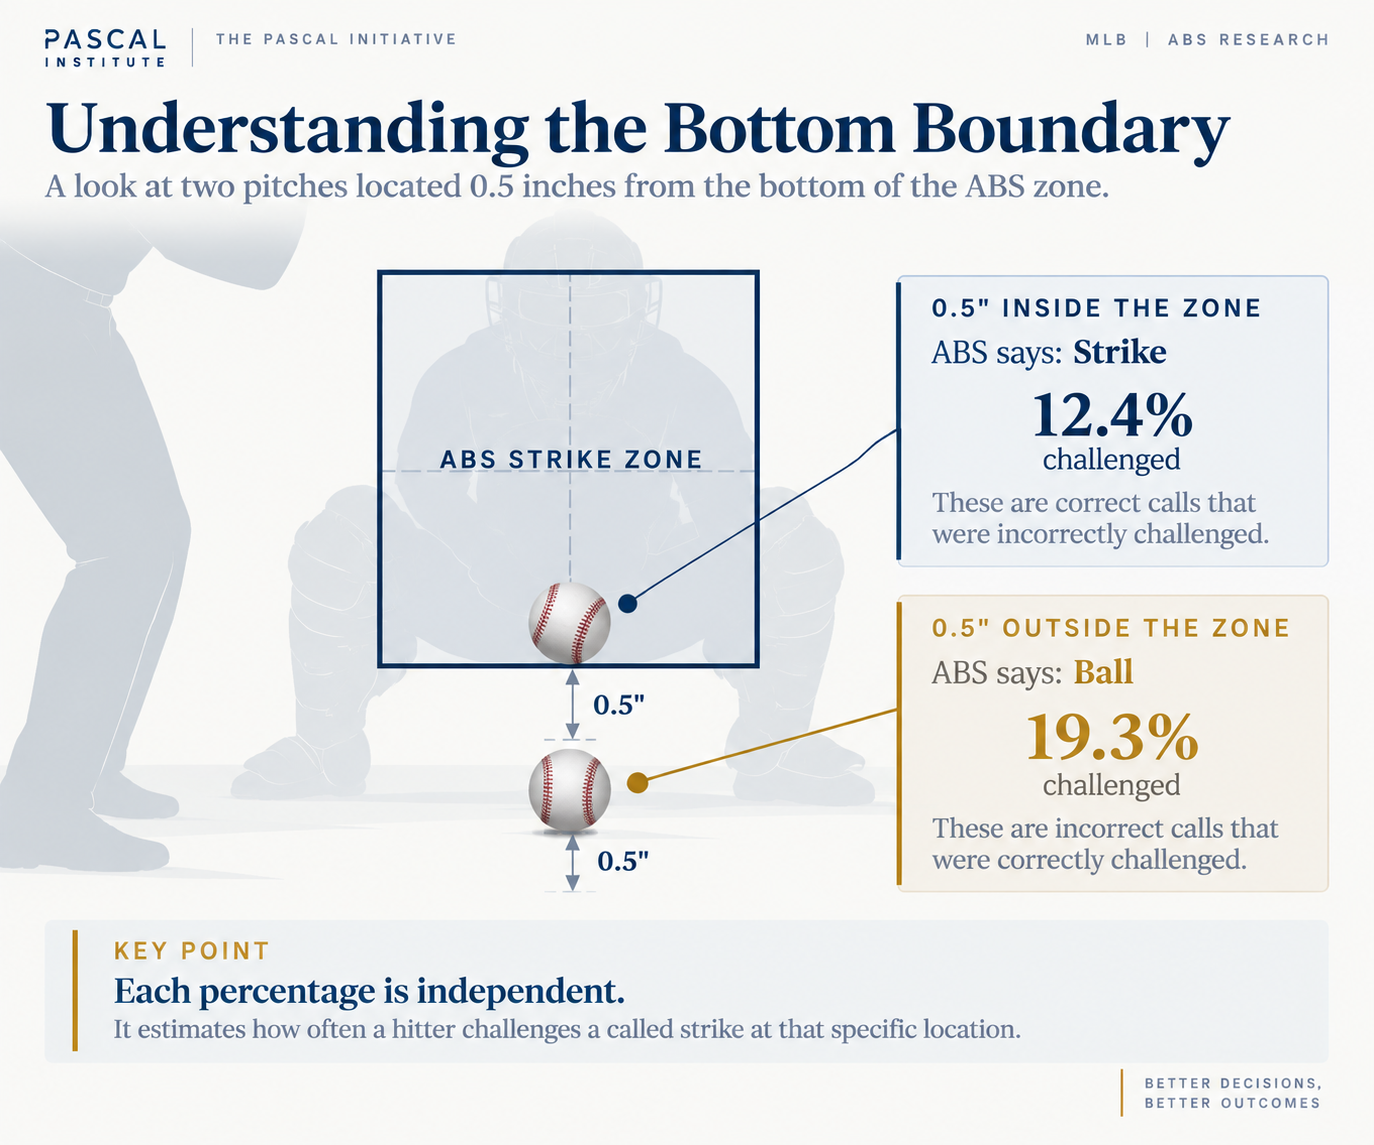
A pitch half an inch inside the bottom boundary is a reconstructed strike. At that location, the publication model estimates that hitters challenged 12.4 percent of the time. Half an inch outside the same boundary is a reconstructed ball; the estimated challenge rate is 19.3 percent.
Applying the same comparison around the zone makes the directional pattern easier to see.
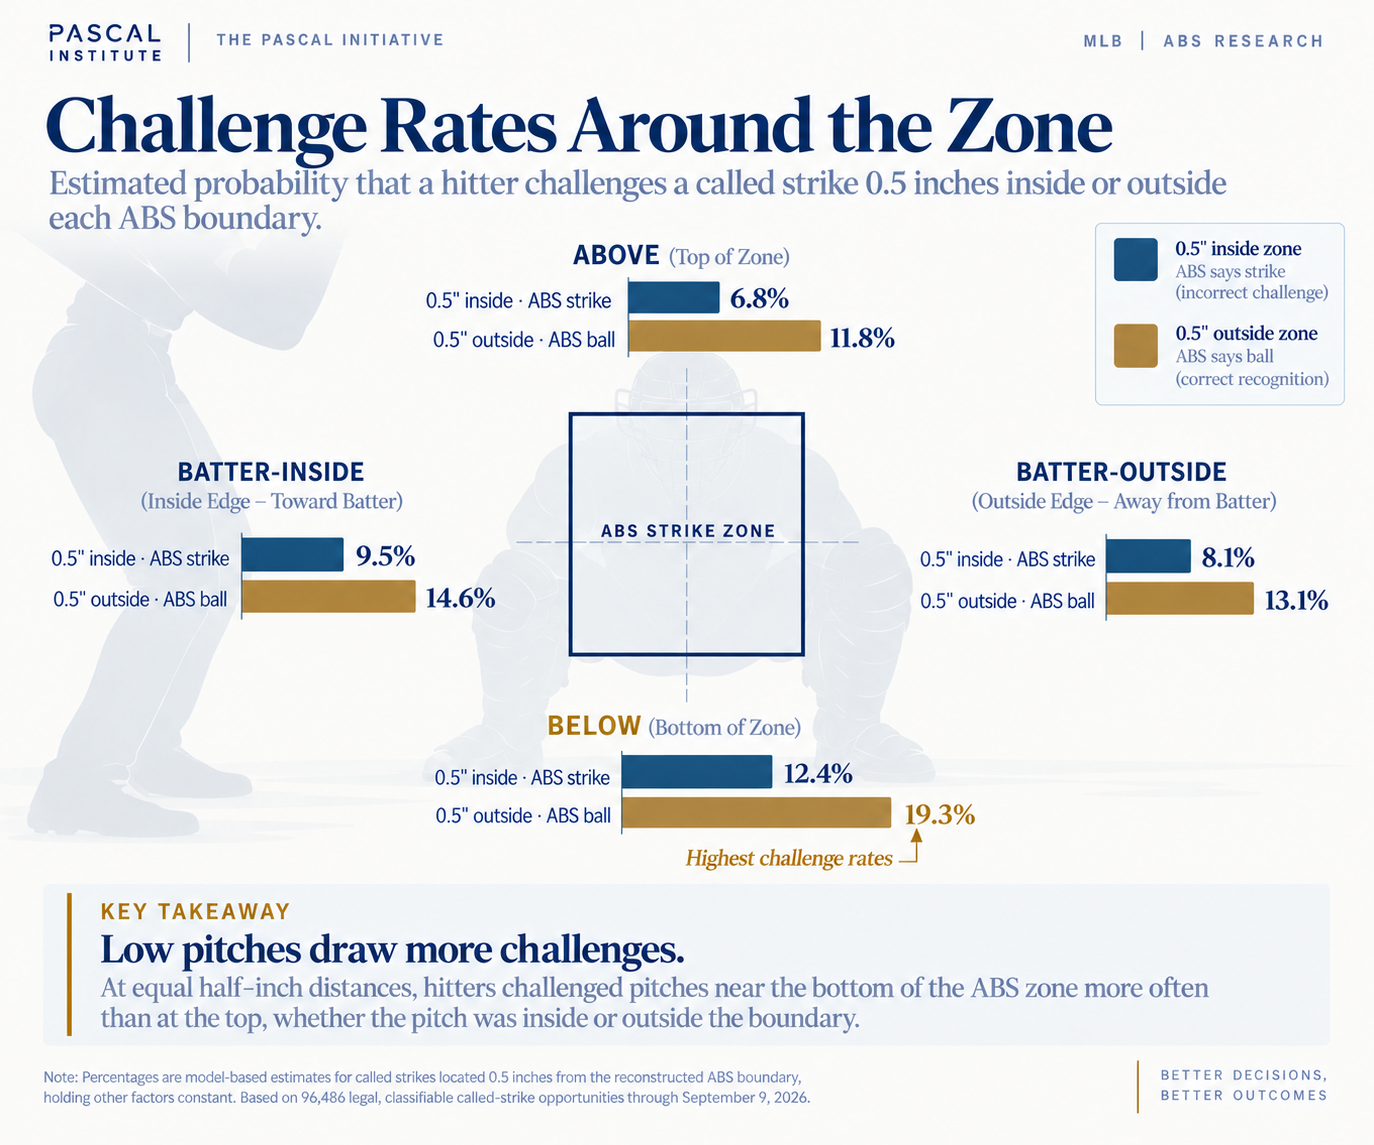
At equal distances, hitters were more willing to challenge low pitches than high pitches. Half an inch outside the bottom, the estimate was 19.3 percent, compared with 11.8 percent above the zone. Half an inch inside, the estimates were 12.4 percent at the bottom and 6.8 percent at the top.
The horizontal differences were much smaller. We found modest evidence of more incorrect challenging at the batter-inside edge, but no clear difference in recognition of actual missed calls. The larger pattern is vertical: hitters challenged low pitches more frequently on both sides of the ABS boundary.
Why low strikes draw more skepticism remains open. Perception may matter, but so might hitter posture, expectations about the traditional zone, catcher presentation, prior umpire calls, coaching, or other unmeasured factors. The defensible conclusion is behavioral: hitters are more skeptical of low called strikes.
Two Strikes Change the Threshold
Geometry is only part of the decision. Count provides the strongest evidence that the consequence of accepting a call matters too. MLB’s public expected-challenge work already includes count and game situation. Our reconstruction lets us compare calls classified as wrong with calls classified as correct.
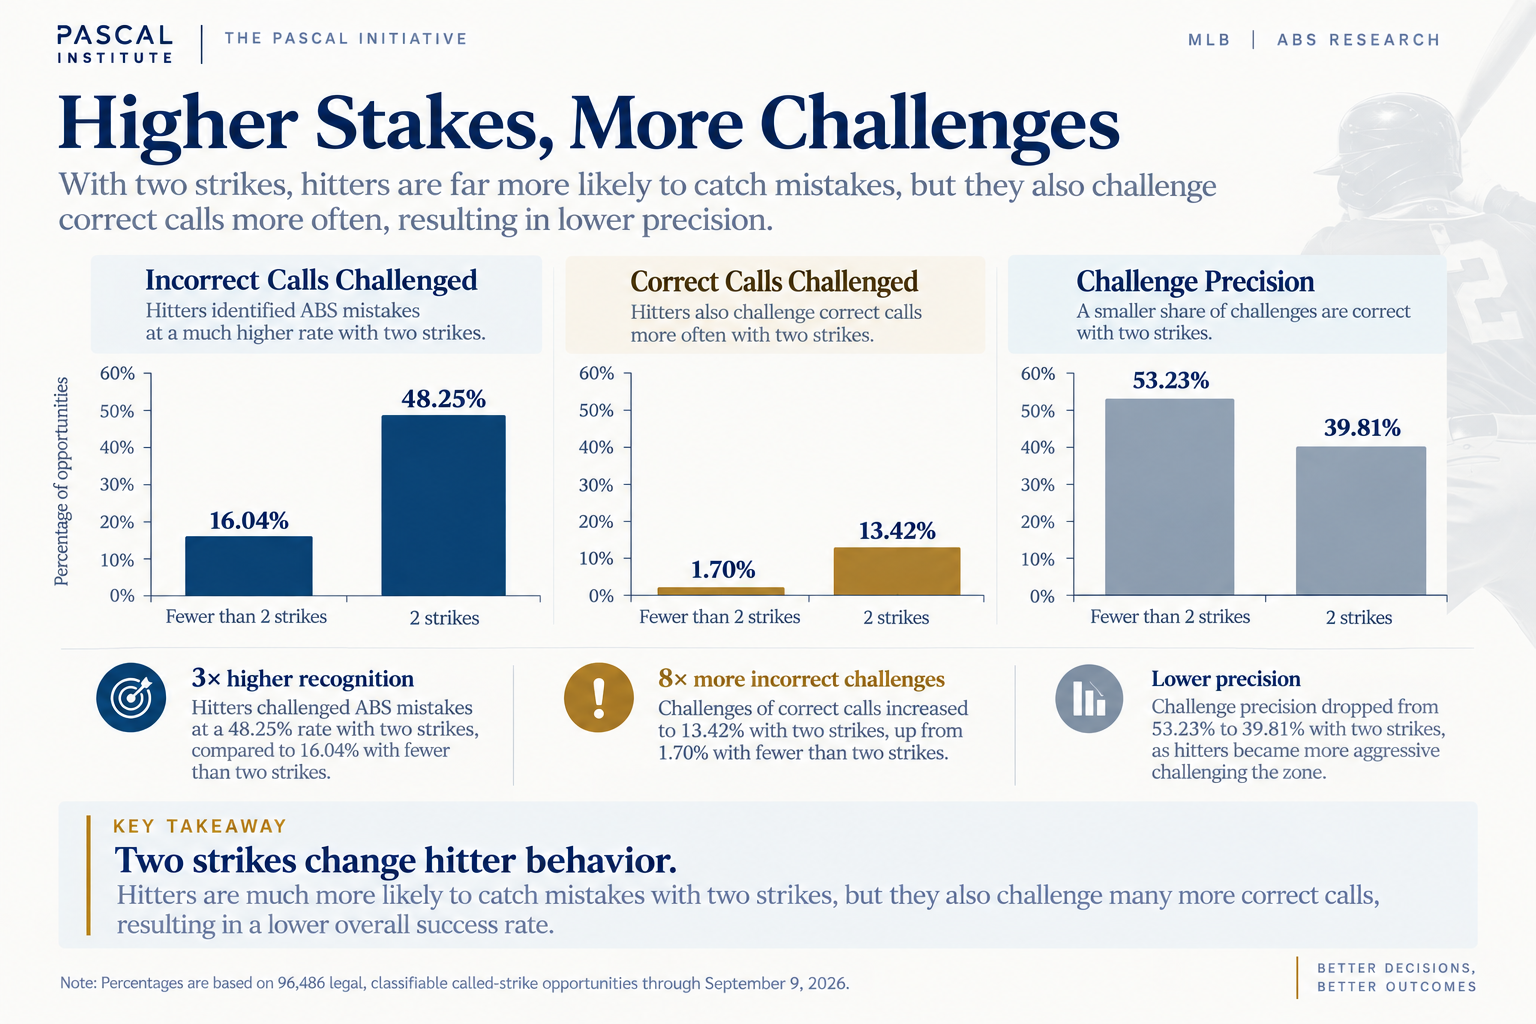
With fewer than two strikes, hitters challenged 16.04 percent of the incorrect calls they encountered. With two strikes, that rose to 48.25 percent.
Correct calls show why this is not simply better recognition. With fewer than two strikes, hitters challenged 1.70 percent of calls where ABS says the umpire was right. With two strikes, that rose to 13.42 percent. Hitters became about three times as likely to catch an incorrect call, but nearly eight times as likely to challenge a correct one. Here, challenge precision means the percentage of hitter challenges that produced an ABS ball. It fell from 53.23 percent to 39.81 percent.
The result looks less like a sudden improvement in recognition and more like a change in how much uncertainty a hitter will tolerate. Adding count to pitch geometry substantially improved our ability to predict whether a hitter would challenge, even when evaluated on held-out data.
A questionable strike on 0-0 changes the count to 0-1. A questionable strike on 3-2 ends the plate appearance. The stakes create a reason to act with less confidence when the alternative is accepting strike three. This analysis does not determine whether any individual challenge was optimal.
The Situation Around the Pitch Matters Too
Late and close changes behavior. Count produced the strongest contextual result, but it was not the only one. In late-and-close situations, defined here as the seventh inning or later with the batting team within two runs, hitters challenged 26.69 percent of reconstructed incorrect calls, compared with 18.31 percent otherwise. Incorrect challenges also rose, from about 2.30 percent to 4.30 percent.
Game context adds information. More broadly, inning, score, outs, runners, and related game-state variables provided additional predictive information beyond pitch geometry and count, although the improvement was considerably smaller than what we observed when adding count. We do not describe this as a measured leverage effect because the dataset does not contain a validated pre-pitch leverage index, which is a measure of how much a single pitch can swing the outcome of a game.
Challenge inventory may matter, but the evidence is limited. Adding challenge inventory to the incorrect-call model produced a small improvement in held-out prediction, but the uncertainty interval included no improvement. The point estimates were consistent with greater restraint when one challenge remained, but the analysis does not establish a distinct inventory effect, and inventory itself reflects earlier game decisions.
Pitch characteristics did not improve held-out prediction. Adding velocity, movement, spin, extension, release position, pitch family, and throwing hand to the selected baseline did not provide reliable additional predictive information once geometry and situation were known. That does not establish that those characteristics have no effect on perception. It tells us only that the group of pitch characteristics we tested did not materially improve prediction.
A Good Decision Is Not the Same as a Good Outcome
An unsuccessful challenge is not necessarily a poor decision. Agreement with ABS and decision quality are different things. A questionable 3-2 strike may be worth challenging even when the hitter is far from certain he will win.
That distinction echoes the decision principle Annie Duke develops in Thinking in Bets: outcomes contain information, but they are not sufficient to judge the quality of the choice that produced them. Our analysis can tell us whether a hitter’s decision agreed with official or reconstructed ABS. It cannot yet tell us whether the decision was worth making.
Article 1 showed that hitters challenged only about one in five estimated incorrect called strikes. Article 2 shows that which calls they challenge depends on more than whether the pitch was outside the zone. Evidence from the pitch, the consequence of doing nothing, and possibly the scarcity of the challenge all help shape the threshold.
Article 3 asks the next question: after accounting for how recognizable a missed call was, does the identity and prior behavior of the hitter still tell us something about what he will do next? That lets us test whether the same evidence produces meaningfully different responses from different people.
Methodology
This analysis uses Pascal Institute’s frozen 2026 season-to-date snapshot from March 25 through September 9: 2,195 completed regular-season games and 645,793 physical pitches. The Article 2 descriptive universe contains 96,486 legal, classifiable called-strike opportunities. Unchallenged pitches receive no official ABS ruling, so their ball-or-strike labels come from Pascal’s public-data reconstruction; challenged pitches use the official result.
The two-sided distance and boundary figures come from the descriptive publication model, whose outcome is whether the hitter challenged. It models signed boundary distance flexibly and includes boundary direction, batter handedness, count, inning, score, outs, base state, and remaining challenge inventory. For each half-inch comparison, we set the pitch location to 0.5 inches inside or outside the named boundary for every opportunity, retained the observed values of the other inputs, and averaged the resulting predicted probabilities. The estimates therefore compare standardized locations; they are not raw cell percentages, causal effects, or direct measures of perception. This full-sample descriptive model is separate from the temporally evaluated incorrect-call model summarized below.
The fixed logistic progression added geometry, count, game context, inventory, and one prespecified pitch-characteristic block. Processing and imputation were fit only on training data. Paired bootstrap intervals, a standard way to estimate uncertainty by rerunning the comparison on many resampled versions of the data, were calculated separately with game and batter clustering. Boundary sensitivity excluded pitches within 0.05, 0.10, 0.25, and 0.50 inches and preserved the main distance and count findings.
Read the full Article 2 methodology, validation results, definitions, and numerical audit.