
Cal Raleigh entered 2026 following one of the most extraordinary offensive seasons ever produced by a catcher. He had hit 60 home runs, become the first primary catcher to reach that milestone, and finished second in the American League MVP voting. By the end of June 2026, the comparison was jarring: Raleigh was hitting .167 with a 70 wRC+, and among hitters with at least 200 plate appearances in both seasons, no player had experienced a larger decline in offensive performance.1
Regression to the mean offers an obvious place to begin. After an extreme performance, particularly one containing some favorable variance, we should expect subsequent results to move closer to the player's underlying level of ability. Raleigh's 2025 season certainly gave us reasons to expect that.
But regression alone does not adequately describe what happened. The deeper we examined Raleigh's 2026 season, the stranger the decline became. His bat speed remained remarkably stable. So did several characteristics of his swing. Yet his quality of contact deteriorated dramatically. His timing changed. An oblique injury interrupted an already difficult season. Raleigh and the Mariners began talking publicly about commitment, pressing, confidence, and the interaction between the physical and mental sides of hitting.1
What began as a question about regression therefore became a broader decision-science question: Can luck affect future performance not only through the outcome it produces, but through the expectations, feedback, and confidence that outcome helps create?
Checkpoint One: What Could We Have Known After 2025?
There is a methodological problem with analyzing Raleigh's 2025 season now. We already know what happened next. Once an extraordinary season is followed by a disappointing one, it is easy to search backward for warning signs and convince ourselves that the decline was predictable. Information that looks obvious after an outcome often looked much less decisive beforehand.
To guard against that, we impose an information cutoff. Imagine that it is December 31, 2025. We know everything that happened during Raleigh's historic season, but nothing about 2026. What would the evidence reasonably have allowed us to conclude?
The first conclusion is important because it prevents us from reducing the story to luck: Raleigh really had become a better hitter. His expected statistics, contact quality, power production, and plate discipline all improved.2
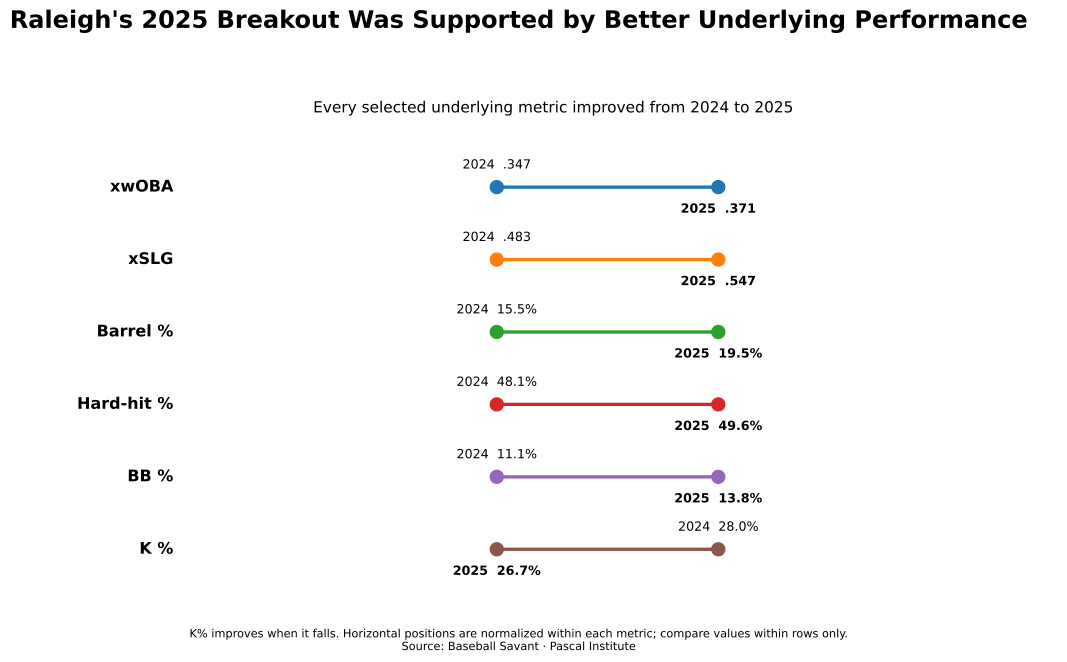
Those are not merely the fingerprints of fortunate outcomes. They are evidence of improved underlying performance. Calling Raleigh's 2025 season "lucky" therefore misses something important. Luck did not manufacture the player who hit 60 home runs. His skills had changed.
There was, however, also evidence that the magnitude of the result exceeded the underlying performance. Raleigh finished 2025 with a .392 wOBA compared with a .371 xwOBA.2 In September 2025, while Raleigh was still pursuing 60 home runs, MLB.com's Mike Petriello noted that Raleigh had 53 actual home runs against 45 park-adjusted expected home runs, then the largest positive gap in Major League Baseball.3 Park-adjusted expected home runs do not identify eight specific “lucky” home runs. They estimate how many home runs a player's collection of batted balls would be expected to produce across Major League parks, accounting for the characteristics of those batted balls and park dimensions. The eight-home-run gap is evidence that favorable variance amplified an already elite power profile, not that 45 home runs were “real” and eight were not.
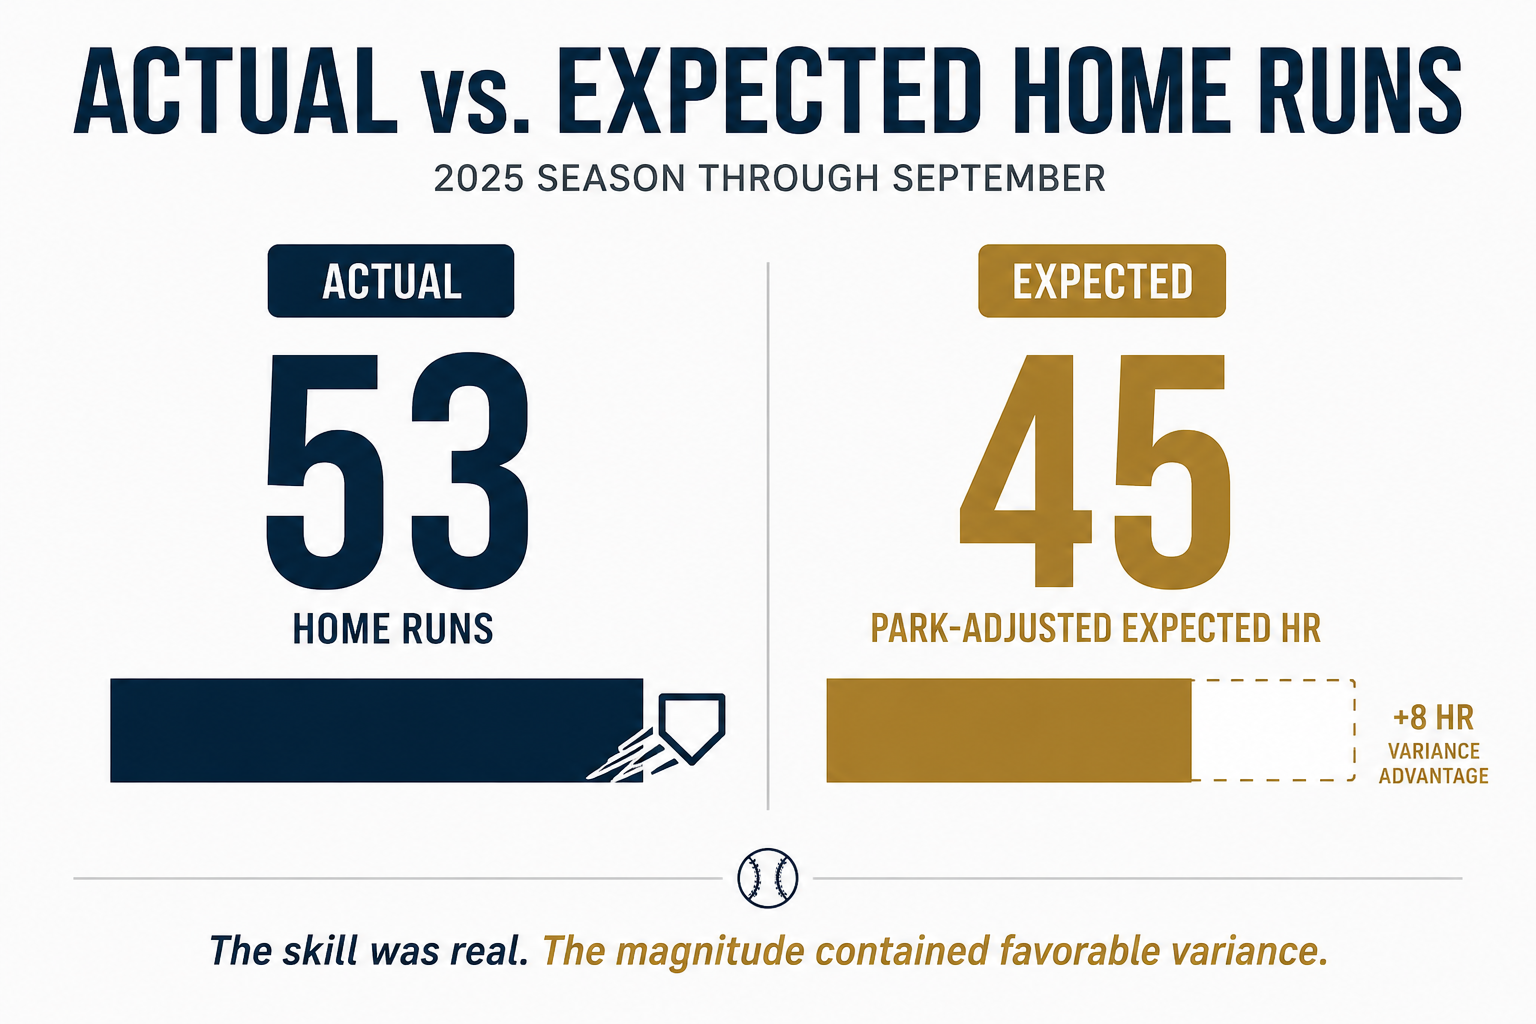
Variance did not create Raleigh's breakout. It amplified it.
Preseason projections reached essentially the same conclusion. Steamer projected Raleigh for 38 home runs, a .346 wOBA, a 129 wRC+ and 5.9 WAR in 2026. ZiPS projected 41 home runs, a .230/.329/.500 slash line, a 136 OPS+ and 6.2 WAR.45 Both systems expected substantial regression from 60 home runs while still projecting Raleigh as an excellent player.
Reasonable expectation: Raleigh's 2025 improvement appeared genuine. Some of the magnitude of his historic results appeared unlikely to repeat. Significant regression should therefore have been expected, but the available evidence provided little reason to expect a collapse.
When Regression Starts to Look Like Something Else
An extraordinary season can have another consequence that projection systems do not attempt to measure: it changes the reference point. Before 2025, a 35- or 40-home-run season from Raleigh would have been remarkable. After 60, the same performance could easily be described as a major decline. Nothing about the hypothetical 40-home-run performance has changed. What changed is the benchmark against which it is evaluated.
This does not mean Raleigh personally expected himself to hit 60 again. His public comments suggested the opposite. Before the 2026 season, he referred to 60 home runs as "the elephant in the room" while making clear that he was not setting out to reproduce it.6 But rationally recognizing that a reference point is unreasonable does not necessarily remove it from the surrounding environment. Every home-run pace, every slump, and every discussion of his performance now existed in comparison with what he had done the year before.
The actual start was worse than ordinary regression. By the time the season reached May, the question was no longer simply why Raleigh was not reproducing 2025. It was why a player projected to remain one of baseball's best hitters had stopped producing anything close to that level.
Checkpoint Two: The Problem Predated the Injury
Raleigh injured his right oblique on May 1. That offers an intuitively satisfying explanation for a hitter struggling to generate power, particularly one whose swing depends on explosive rotational movement. The chronology does not allow us to use it as the complete explanation.
Raleigh was already struggling before the injury. MLB.com's May analysis reported a pre-injury slash line of .186/.272/.380 and found that his average bat speed had declined only slightly, from 75.2 mph in 2025 to 74.7 mph. Yet his contact had moved roughly two inches deeper, and his production against 95-plus-mph velocity had collapsed.7
The July evidence made the distinction even clearer. Raleigh's bat speed was still 74.6 mph, almost unchanged from 75.2 the year before, and the analysis found no meaningful change in his swing path. Driveline Baseball's work instead found that Raleigh's timing distribution had widened. Against fastballs specifically, his average depth of contact had moved from 5.2 inches in front of the plate in 2025 to 1.9 inches in 2026. His out-of-zone swing rate had risen to 37%, while his slugging percentage on pitches outside the strike zone had fallen from .347 to .063.1
The physical machinery was still largely there. The bat could still move at approximately the same speed, along a similar path. What had changed was the hitter's ability to deliver that swing to the baseball at precisely the right time.
Raleigh's own comments from April are interesting in that context. On April 22, while trying to emerge from his difficult start, he described trying to get to a place of "committing to something" and remaining locked in on each pitch rather than letting one result influence what came next.8 Those comments do not prove that he lacked confidence. They do establish that, before the injury, Raleigh himself was already talking about the relationship between results, commitment, and subsequent execution.
When a Timing Problem Meets an Injury
Raleigh hurt his oblique on May 1, returned on May 5 and attempted to play through the injury before Seattle eventually placed him on the injured list. He returned June 16.1 Looking back on the interruption, Raleigh explicitly connected physical recovery with being able to feel confident swinging. Mariners general manager Justin Hollander went further, describing a sequence in which the physical problem affected the mental side of hitting and suggesting that hitters returning from extended absences can begin expanding the strike zone before becoming locked in again.1
The injury did not cause the original timing problem because the problem existed first. But that does not make the injury irrelevant. A hitter who is already struggling to synchronize an elite motor skill now has a physical reason to be uncertain about an explosive movement that normally has to occur with very little conscious deliberation.
What Happens When an Automatic Skill Stops Feeling Automatic?
Elite hitting is not performed as a sequence of conscious instructions. A major-league hitter has only a fraction of a second to recognize a pitch, determine whether to swing, and execute a highly coordinated movement. With expertise, much of that process becomes procedural and automatic.
Research in motor performance suggests that automaticity can become vulnerable under pressure. Beilock and Carr found that skilled performers normally rely on proceduralized movements that require little step-by-step attentional control, but that directing attention back toward the mechanics of an automated skill can impair performance under pressure.9 Research with experienced collegiate baseball players has likewise found that pressure can shift attention inward toward skill execution and that greater skill-focused attention can be associated with poorer batting performance.10
That does not establish that Raleigh was consciously controlling his swing in 2026. Statcast cannot measure a thought. But the mechanism is relevant because Raleigh's physical capacity to swing the bat remained largely intact while his timing and contact quality deteriorated.
Success Can Produce Confidence Too
It is easy to treat confidence as an explanatory variable after the fact. An athlete succeeds because he was confident; he fails because he lost confidence. Used that way, confidence becomes almost impossible to falsify. The research is more nuanced.
Lochbaum and colleagues' 2022 meta-analysis reviewed 41 studies involving 3,711 athletes across 24 sports and found a positive but modest relationship between self-confidence and athletic performance, with an overall correlation of .25.11 A 2023 meta-analysis of pre-event self-efficacy found a similar positive relationship, around .31 overall.12 Confidence matters, but it is not a deterministic explanation of performance.
More relevant to Raleigh is research asking which direction the relationship runs. Sitzmann and Yeo found that previous performance predicted subsequent self-efficacy more strongly than self-efficacy predicted later performance. After controlling for performance trends, prior performance remained positively associated with later self-efficacy while the reverse relationship became much weaker.13
That finding changes the way we should think about confidence in sports. Success does not merely follow confidence. Success can help create it.
Randomness can enter that system at any point. Consider two nearly identical swings that produce 102 mph line drives. One goes directly to the shortstop. The other travels six feet to his left. From the standpoint of underlying execution, the two events may tell us almost the same thing. Psychologically, however, the outcomes are not necessarily equivalent. One hitter walks back to the dugout with another out recorded against him. The other stands on first base after seeing a hit appear on the scoreboard.
The difference may be largely variance. But if performance influences subsequent confidence, the consequences of that variance need not end with the play itself.
This possibility takes us back to Raleigh's 2025 season. Favorable variance appears to have helped transform genuine improvement into a historic result. That historic result then became part of the environment surrounding everything that followed. Sixty home runs became the reference point. Ordinary regression looked more disappointing. Poor early results accumulated. Then came injury, an interruption in repetitions, and further struggles.
None of this establishes that 60 home runs caused Raleigh's 2026 timing problems. It suggests something more modest and more interesting: outcomes can become inputs into future performance.
Checkpoint Three: Stop the Clock on August 23
On August 24, Raleigh hit three home runs against Philadelphia.14 Knowing that outcome creates exactly the same hindsight problem we encountered when looking backward from 2026 into 2025. Once we know that Raleigh was about to hit three home runs, any positive event from the preceding week can suddenly look like an obvious sign that a breakout was coming.
So we stop the clock again. Imagine that it is the evening of August 23. We do not know what Raleigh will do tomorrow. Is there evidence, independent of the coming outcome, that something in his underlying performance has begun to change?
Baseball Savant's bat-tracking data allow us to examine Raleigh's average intercept point, essentially where the bat and ball meet. Savant's Batting Stance & Intercept leaderboard reports it relative to the front edge of home plate. For Raleigh batting left-handed, that figure was -1.37 inches from August 1-10 and +7.26 inches from August 11-23, a move of about 8.6 inches forward. His depth in the box moved only from 30.94 to 29.46 inches, so about 7.2 inches of the move was relative to his own body rather than to where he stood. Taken at face value, that looks like a hitter who was late in early August and suddenly on time.
The pitch-level data tell a different story. Where contact happens depends heavily on the pitch. Hard fastballs and pitches on the outer part of the plate are met deeper, while slower pitches and pitches on the inner half are met further out front. From August 1-10, 86 percent of the pitches Raleigh swung at batting left-handed were fastballs, averaging 93.9 mph and mostly located away from him. From August 11-23, 60 percent were fastballs, averaging 90.7 mph and closer to the middle of the plate. When we compare each swing with where Raleigh made contact on similar pitches in 2025, the mid-August shift disappears.
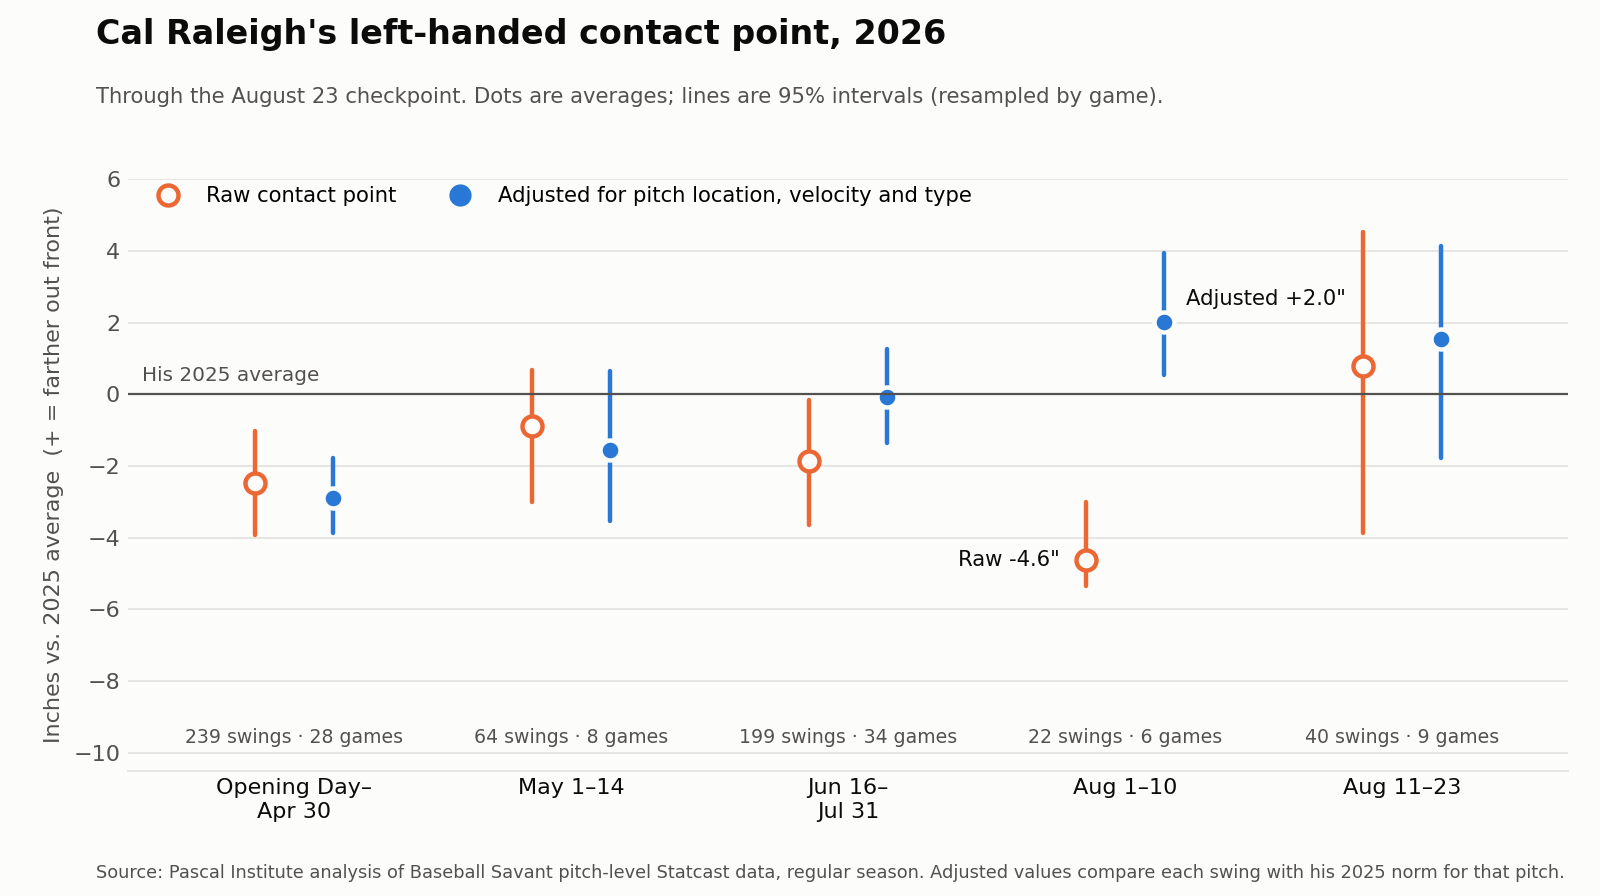
Against that norm, Raleigh was meeting the ball about 2.0 inches further out front than usual from August 1-10 (95 percent interval +0.5 to +3.9 inches, 22 swings in six games), and about 1.5 inches further out front from August 11-23 (-1.8 to +4.1, 40 swings in nine games). The change between the two windows was about half an inch in the other direction, well within the noise. The early-August contact was not late for those pitches. Hard fastballs on the outer half are met deep in the zone, and Raleigh was meeting them slightly further out front than he had in 2025. The conclusion held with a richer model of location and count, with contact-only swings, with competitive swings only, and with a baseline drawn from his own June and July swings.
The same adjustment confirms the earlier part of the story. From Opening Day through April 30, Raleigh met the ball about 2.9 inches deeper than his 2025 norm for the same pitches (-3.9 to -1.8, 239 swings), consistent with MLB.com's pre-injury report. From June 16 through July 31, that gap had closed (-0.1 inches, -1.4 to +1.3, 199 swings). The deeper contact the data can see was concentrated early in the season. By August 23, the intercept data no longer showed a timing deficit, and they showed no new change in progress.
The batted-ball record from those two weeks is also more mixed than it first looks. Raleigh produced 105.2 mph contact on August 12 and 100.7 mph contact on August 14 batting left-handed. Batting right-handed, he homered on August 16, hit a 107.2 mph, 410-foot home run on August 21, produced 105.9 mph contact on August 22 and followed with a 102.4 mph hit on August 23.15 Most of the hard contact came from the right side. Batting left-handed, the side the intercept data describe, his balls in play from August 15 through 23 ranged from 77.6 to 98.9 mph, and none fell for a hit. None of those observations justified declaring the slump over, and they gave no clean signal about his left-handed swing.
Then we restart the clock.
August 24
Raleigh hit three home runs, all batting left-handed.
The temptation is to call that confirmation. We should resist it. Three home runs do not prove that Raleigh's timing problems have disappeared, just as three strikeouts in his next game would not prove that nothing had changed. The home runs are outcomes.
The more useful observation is one our own checkpoint nearly missed. The raw intercept numbers looked like a leading indicator, and they were not. Read at face value, they would have made the three home runs seem to confirm a signal that was really a change in the pitches Raleigh was seeing. Stopping the clock guards against hindsight only if the evidence gathered at the checkpoint is measured carefully too.
What the Raleigh Case Can and Cannot Tell Us
There is a relatively firm evidentiary foundation beneath parts of this story. Raleigh genuinely improved in 2025, while some of the magnitude of his results exceeded expected measures. Regression entering 2026 was therefore foreseeable, but the degree of his decline was not what major projection systems anticipated. His bat speed and several characteristics of his swing remained surprisingly stable while contact quality and timing deteriorated. Those timing problems were visible before the oblique injury, which prevents us from treating the injury as a complete explanation. Our own pitch-level data support that early-season picture: through April, Raleigh's contact was deeper than his 2025 norm for the same pitches, and by midsummer it was not.
The psychological explanation deserves a different evidentiary label. Raleigh's comments about commitment and feeling confident swinging, along with Hollander's description of the interaction between the physical and mental sides of hitting, make confidence and conscious interference reasonable hypotheses. Research establishes that confidence is related to athletic performance, that previous performance can affect subsequent self-efficacy, and that excessive conscious monitoring can disrupt automated motor skills.891113
What none of those sources can establish is what Raleigh was thinking during an individual swing. We cannot assign some percentage of his decline to confidence and another percentage to injury, mechanics, pitcher adjustments or randomness. We cannot prove that the expectations created by a 60-home-run season caused him to press. Nor did the data available on August 23 show that his difficulties were resolving. The mid-August move in his contact point reflected the pitches he saw, and most of the hard contact in that stretch came from his right-handed swing.
Those limitations are not weaknesses in the analysis. They are part of the conclusion. Good analysis requires distinguishing between what the evidence establishes, what it makes plausible, and what remains unknown.
The Larger Lesson
We often describe luck and skill as though they are two independent ingredients mixed together to produce an outcome. Skill creates an underlying probability of success, randomness pushes individual results around that expectation, and with enough observations we hope the noise begins to wash away.
For human decision-makers, the process may not be so clean. An outcome becomes part of the information available before the next decision. It can alter expectations. It can provide positive or negative performance feedback. Research gives us reason to believe that this feedback can influence subsequent confidence, while pressure and conscious attention can sometimes influence execution. In that sense, randomness may not merely obscure skill. Under some circumstances, it may alter the environment in which that skill is expressed.
That principle extends well beyond baseball. A bettor can experience a fortunate winning streak and mistake favorable variance for exceptional ability, then abandon a sound process when losses arrive. An investor can experience extraordinary returns during a bull market and reset expectations around an unsustainable result. A business can build next year's targets around an unusually favorable year. An athlete can produce a historic season and discover that merely excellent performance now appears disappointing.
The contexts are different, but the decision problem is similar: yesterday's outcome becomes part of today's decision environment.
Separating process from outcome remains one of the foundations of good decision-making. Raleigh's case suggests another layer worth considering: the outcome itself can influence the process that follows.
Luck does not necessarily end with the outcome it helped produce. Sometimes the bounce of the ball changes the person who takes the next swing.
The same discipline applies to the evidence we use to judge that process. A number that seems to anticipate an outcome deserves the same scrutiny as the outcome itself.
Methodology
This case study uses publicly available Baseball Savant, MLB and FanGraphs data; contemporaneous reporting and player/front-office comments; and peer-reviewed literature on confidence, self-efficacy, attention, automaticity and skilled motor performance.
To reduce hindsight bias, the analysis uses explicit information cutoffs. The first asks what could reasonably have been concluded at the end of 2025 before observing the 2026 season. The second asks what was already observable before Raleigh's May 1 oblique injury. The third stops the clock on August 23, one day before his three-home-run game, to evaluate whether signs of change were visible before the result became obvious.
The intercept analysis uses Baseball Savant data for Raleigh's regular-season swings in predefined windows: full-season 2025; Opening Day through April 30, 2026; May 1-14; June 16-July 31; August 1-10; and August 11-23. Switch-hitting results were evaluated separately by batting side, and the intercept results reported here are for Raleigh batting left-handed. Savant's Batting Stance & Intercept leaderboard gives plate-relative intercept values of +5.20 inches for 2025, -1.37 inches for August 1-10 and +7.26 inches for August 11-23, with depth in the box of 30.94 and 29.46 inches in the two August windows. The leaderboard does not report how many swings stand behind each value, and it cannot account for the pitches a hitter swung at.
We therefore also used Savant's pitch-level Statcast data, which record for each tracked swing the distance from the batter to the point of contact. Using Raleigh's 957 tracked 2025 left-handed swings, we fitted a linear model of that distance on pitch location (horizontal and vertical), release speed, and fastball and breaking-ball indicators. Each window's adjusted value is the average difference between his swings and that model, so zero means his 2025 norm for the pitches he swung at. Intervals are 95 percent bootstrap intervals that resample whole games. The conclusions held with a richer model adding squared and interaction location terms, the count and individual pitch types; with contact-only swings; with swings of at least 60 mph; and with a baseline fitted only on July-September 2025 or on his June 16-July 31, 2026 swings. Raleigh's contact point drifted about an inch further out front during the second half of 2025, which does not change these conclusions. The August windows are short, 22 and 40 tracked swings, so these results remain exploratory. The batted-ball values in Checkpoint Three come from the same pitch-level data, with batting side recorded. Data were retrieved from Baseball Savant on October 14, 2026. The code, the content-addressed inputs and a manifest of outputs are kept in Pascal Institute's research repository.
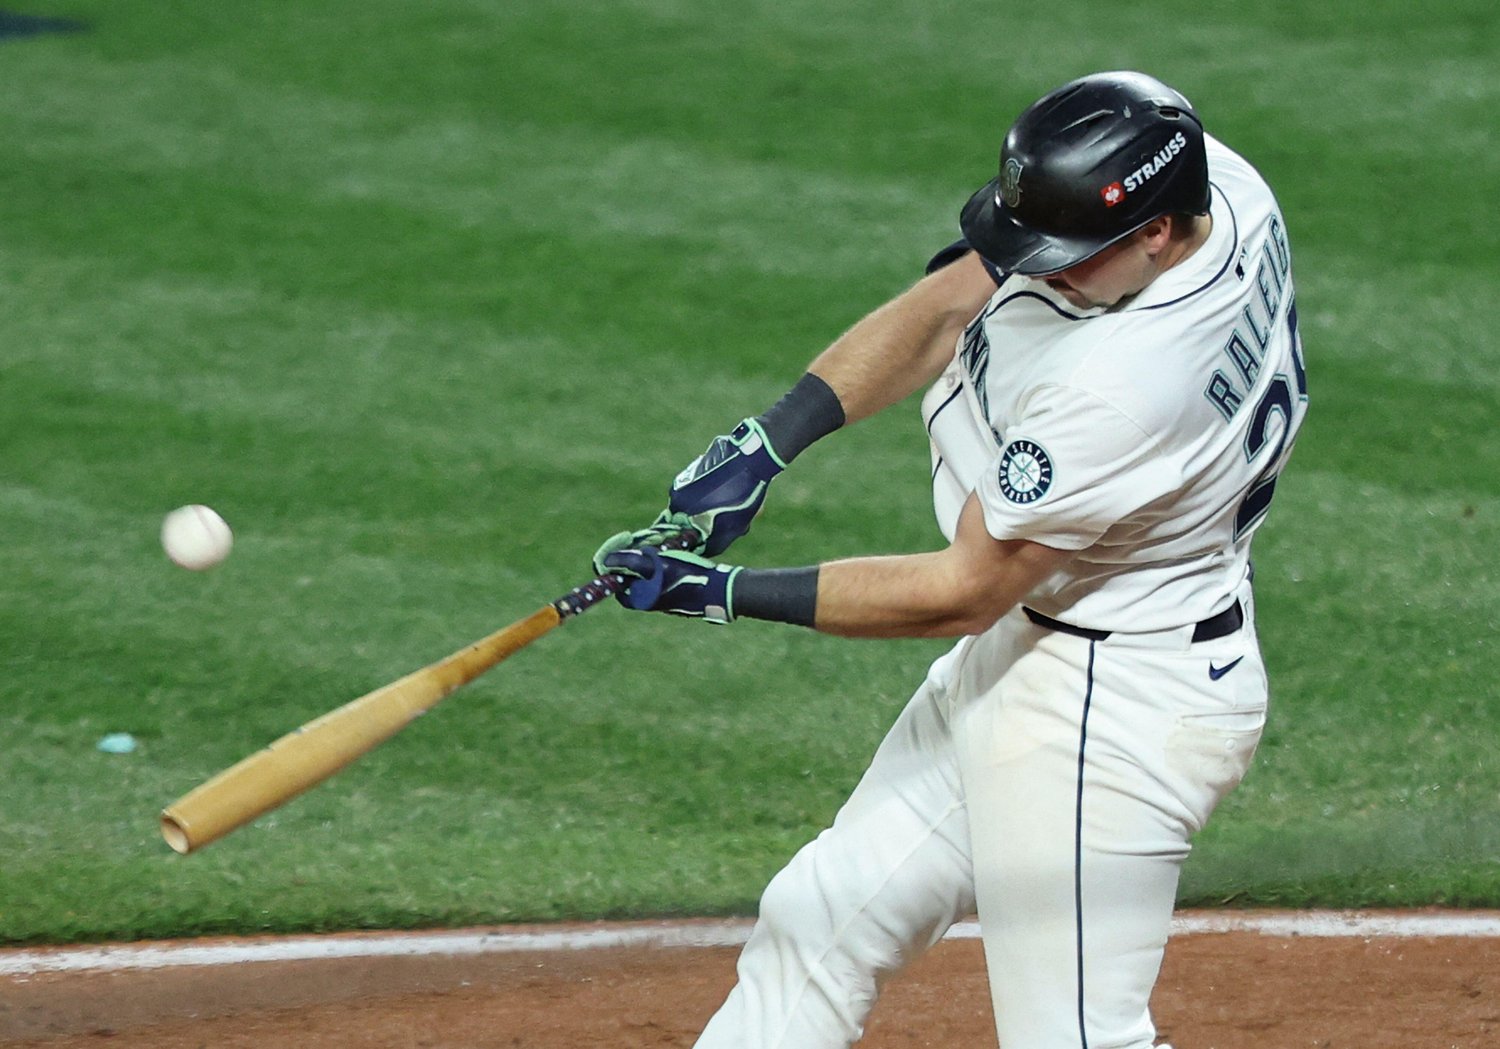
The Cal Raleigh action photograph is separately licensed from Alamy for editorial use. It is used only within this research article and is not part of the Pascal Institute data graphics.
References
- MLB.com. "Searching for answers to Raleigh's mysterious struggles." July 2026. Includes the 70 wRC+ comparison, oblique timeline, 2025/2026 bat-speed comparison, Driveline timing analysis, fastball contact depth, chase rate, out-of-zone slugging, and comments from Raleigh and Mariners GM Justin Hollander. Source.
- Baseball Savant. Cal Raleigh Statcast career and season metrics. Used for 2024 and 2025 xwOBA, xSLG, barrel rate, hard-hit rate, walk rate, strikeout rate, and 2025 wOBA. Source.
- Petriello, Mike. MLB.com. "Can Raleigh reach 60-homer plateau? Here's his path." September 9, 2025. Contemporary analysis reporting 53 actual home runs versus 45 park-adjusted expected home runs at that point in the season. Source.
- FanGraphs. 2026 Steamer projections. Raleigh projected for 38 HR, .346 wOBA, 129 wRC+ and 5.9 WAR. Source.
- FanGraphs. "2026 ZiPS Projections: Seattle Mariners." December 18, 2025. Raleigh projected for 41 HR, .230/.329/.500, 136 OPS+ and 6.2 WAR. Source.
- NBC Sports / Associated Press. Preseason 2026 coverage of Raleigh's expectations after his 60-home-run season, including his description of 60 as "the elephant in the room" and his emphasis on consistency rather than reproducing the total. Source.
- MLB.com. "Cal Raleigh's early 2026 struggles, explained." May 2026. Reports Raleigh's pre-injury .186/.272/.380 line, 74.7 mph bat speed versus 75.2 mph in 2025, deeper contact and poor performance against high velocity. Source.
- MLB.com. Mariners coverage from April 22, 2026. Includes Raleigh's comments about "committing to something" and preventing one result from influencing the next pitch. Source.
- Beilock, S. L., & Carr, T. H. (2001). "On the fragility of skilled performance: What governs choking under pressure?" Journal of Experimental Psychology: General, 130(4), 701-725. Source.
- Gray, R. Research on attention and experienced baseball hitters under pressure. Experienced collegiate hitters showed greater skill-focused attention under pressure, with that attention associated with poorer performance. Source.
- Lochbaum, M., Sherburn, M., Sisneros, C., & Cooper, S. (2022). "Revisiting the self-confidence and sport performance relationship: A systematic review with meta-analysis." International Journal of Environmental Research and Public Health, 19(11), 6381. Forty-one studies, 3,711 athletes, 24 sports; overall correlation approximately .25. Source.
- JeKauc, D., et al. (2023). Meta-analysis of pre-event self-efficacy and sport performance. Reported an overall relationship of approximately .31 across the included samples. Source.
- Sitzmann, T., & Yeo, G. (2013). "A meta-analytic investigation of the within-person self-efficacy domain: Is self-efficacy a product of past performance or a driver of future performance?" Personnel Psychology, 66, 531-568. Source.
- Reuters. August 25, 2026. Report on Raleigh's first career three-home-run game on August 24 against Philadelphia. Source.
- Baseball Savant / MLB Statcast game records. Late-August batted-ball sequence used in the August 23 checkpoint: 105.2 mph on Aug. 12 and 100.7 mph on Aug. 14 (batting left-handed); HR on Aug. 16, 107.2 mph and 410 feet on Aug. 21, 105.9 mph on Aug. 22 and a 102.4 mph hit on Aug. 23 (batting right-handed). Left-handed balls in play Aug. 15-23 ranged from 77.6 to 98.9 mph. All values and batting sides re-verified against pitch-level Statcast data on October 14, 2026. Source.