
Every October, someone on a broadcast says a great hitter is late. This month the word has followed Shohei Ohtani through the playoffs. It suggests a hitter who is behind the pitch, reacting instead of attacking. The advice that comes with it is just as familiar: get the bat out in front. For most of baseball history, nobody outside a team could check that diagnosis, because nobody could see exactly where the bat met the ball. Since 2025, Statcast has measured it on nearly every swing, as the distance from the middle of the hitter's body to the point of contact, in inches toward the pitcher.1
That turns "late" from a feeling into a number, so we asked a simple question of it. When a hitter meets the ball further out in front than he usually does, what actually happens? We started with a hunch shared by many coaches and fans. A comfortable hitter gets the bat out early and piles up hits, while a slumping hitter falls behind. We checked that idea across every tracked swing in the 2025 and 2026 MLB regular seasons. The answer we found is not that hitters get more hits out front. It is that their hits change shape.
First, Take the Pitch Out of It
Where a hitter makes contact depends heavily on what he is swinging at. Faster pitches are met deeper, by about half an inch for every extra mile per hour, while inside pitches are met further out in front. Under our model, the pitch's location, speed, and type, along with the count, explain nearly half of the swing-to-swing movement in a hitter's contact point.2 A raw contact-point number is therefore mostly a reading of the pitches a hitter has been seeing. A week of good fastballs can make anyone look late. So every comparison below first removes what the pitch explains, and then compares each hitter only with his own usual contact point, never with the league.
The View From Above the Plate
Start with geography. Picture home plate from directly above, with the pitcher toward the top of the page and the hitter standing to the left. In 2025, the average ball put in play was struck about 2 inches in front of the plate's front edge.3 Home runs came from somewhere else. They clustered roughly 10 to 20 inches in front of the plate, on the half nearest the hitter, while singles were struck deeper, over the plate itself.
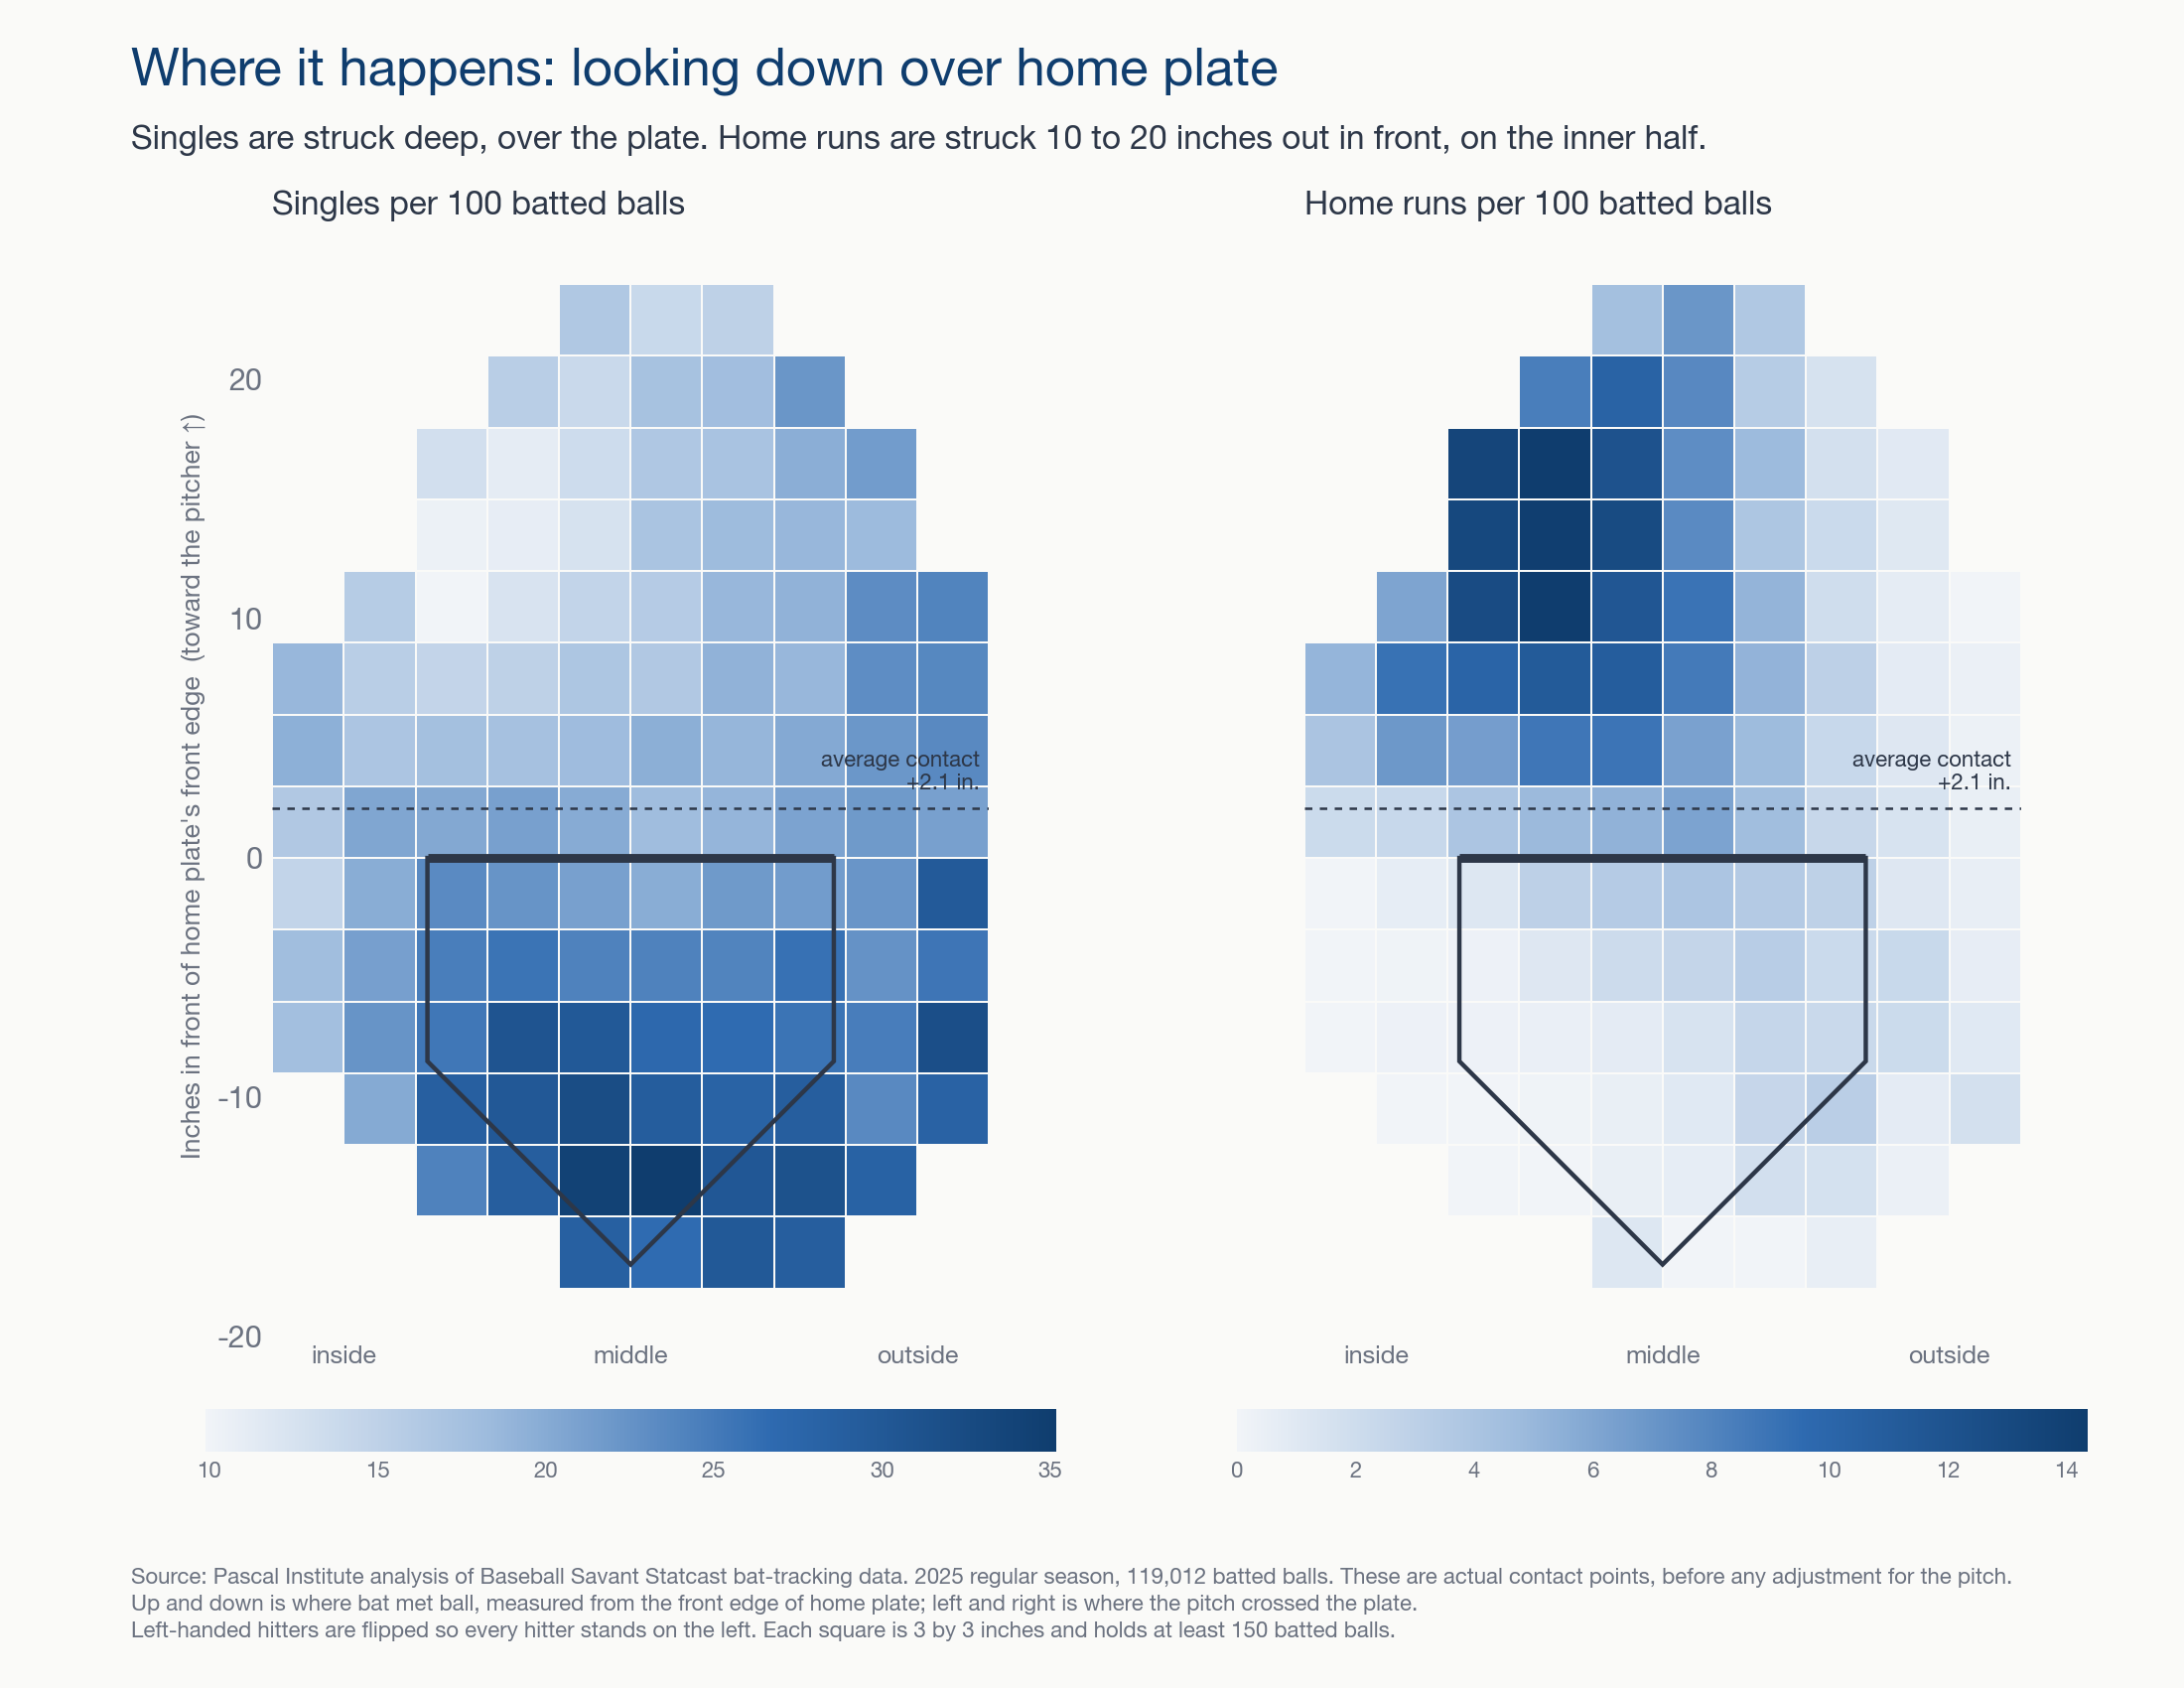
That map shows where things happen, but it cannot yet say what a hitter did differently, because inside pitches and outside pitches are met in different places. To separate the hitter from the pitch, we turn to the comparison that matters most. We take each hitter's own swings, adjust them for the pitch, and ask what happens when he is earlier or later than his normal self.
The Trade: Singles for Power
We sorted every 2025 batted ball into five equal groups, from the deepest contact relative to that hitter's norm to the furthest out in front. Then we counted what each group became.4 Across the five groups, hits barely moved. The deepest group produced 32.8 hits per 100 batted balls, and the most out-front group produced 31.3. What changed was what those hits turned into.
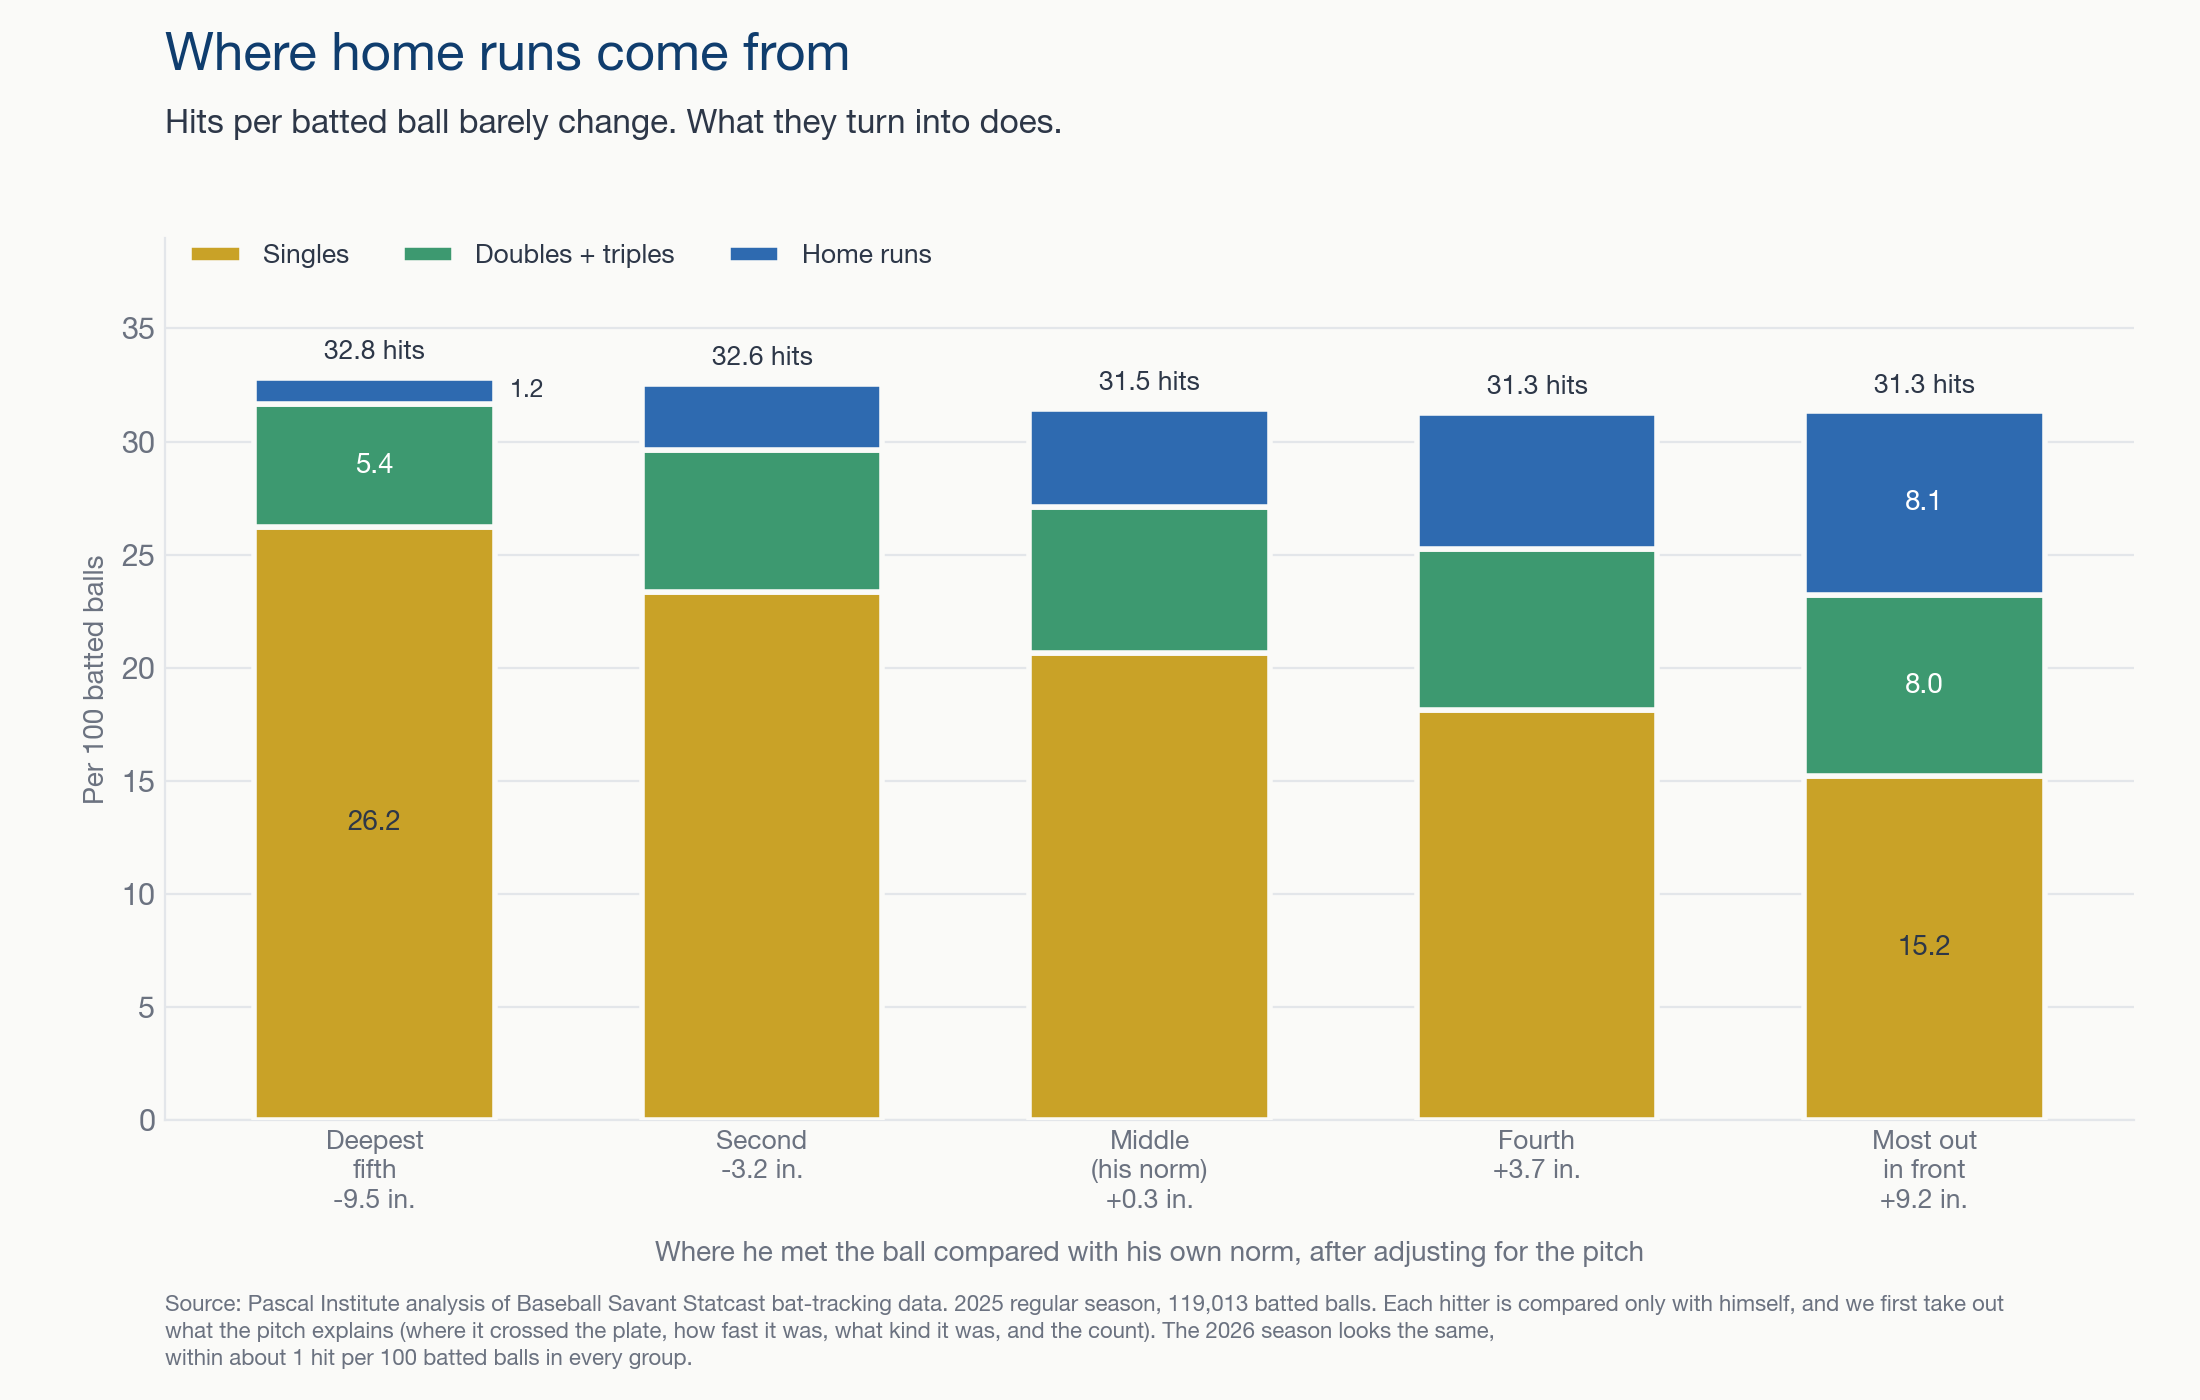
When a hitter's contact was furthest out in front of his own norm, about 8 in 100 batted balls left the park. In his deepest contact, about 1 in 100 did. Singles moved the other way, from about 26 per 100 to about 15. Doubles and triples rose along with the home runs, and total bases per batted ball climbed by roughly half. Earlier public work by Ben Clemens at FanGraphs found that contact near a hitter's usual point produced the best expected results.5 Our groups add what happens on either side of that point. Deeper contact keeps the singles, and out-front contact turns them into extra bases.
We expected something different, and we wrote it down before testing it on 2025: that contact out in front would cost hits. It did not. The difference between a hitter's normal contact and his most out-front contact was a tenth of a hit per 100 batted balls, well inside the noise. There is a cost to meeting the ball early, but it shows up before the ball is in play, because out-front swings also miss more often. For every 8 inches further in front, hitters missed about 2.5 more times per 100 swings.
Over a Stretch
Single batted balls are one thing, but fans experience hitters in stretches of games. We split each hitter's 2025 season into stretches of 10 games and compared the stretches with each other.6 Isolated power counts the extra bases a hitter gets beyond singles, per at-bat. When a hitter's contact moved forward, his isolated power tended to rise with it. His batting average did not reliably change. The link was modest, about +0.10 on a scale where zero means no relationship and 1 means lockstep. Still, it kept its direction in every version of the test we ran.
Contact point also moves slowly. Where a hitter met the ball over his last 10 games still said something about where he would meet it 15 games later. It behaves less like a daily mood and more like a phase that lasts for weeks. That combination, a slow-moving state tied to power, is what made the idea of reading streaks from it so appealing.
Three Hitters, Two Seasons
Three hitters show the pattern in a form that is easier to see than a league average.7 Ty France broke out in 2026, hitting 21 home runs after 7 the year before. His isolated power went from .104 to .207. Cal Raleigh followed a 60-homer 2025 with a hard 2026, finishing with 23 home runs and an isolated power of .188 after .342. Shohei Ohtani went from 55 home runs to 30, and his isolated power fell from .340 to .237. Their contact points moved the way the league pattern would suggest.
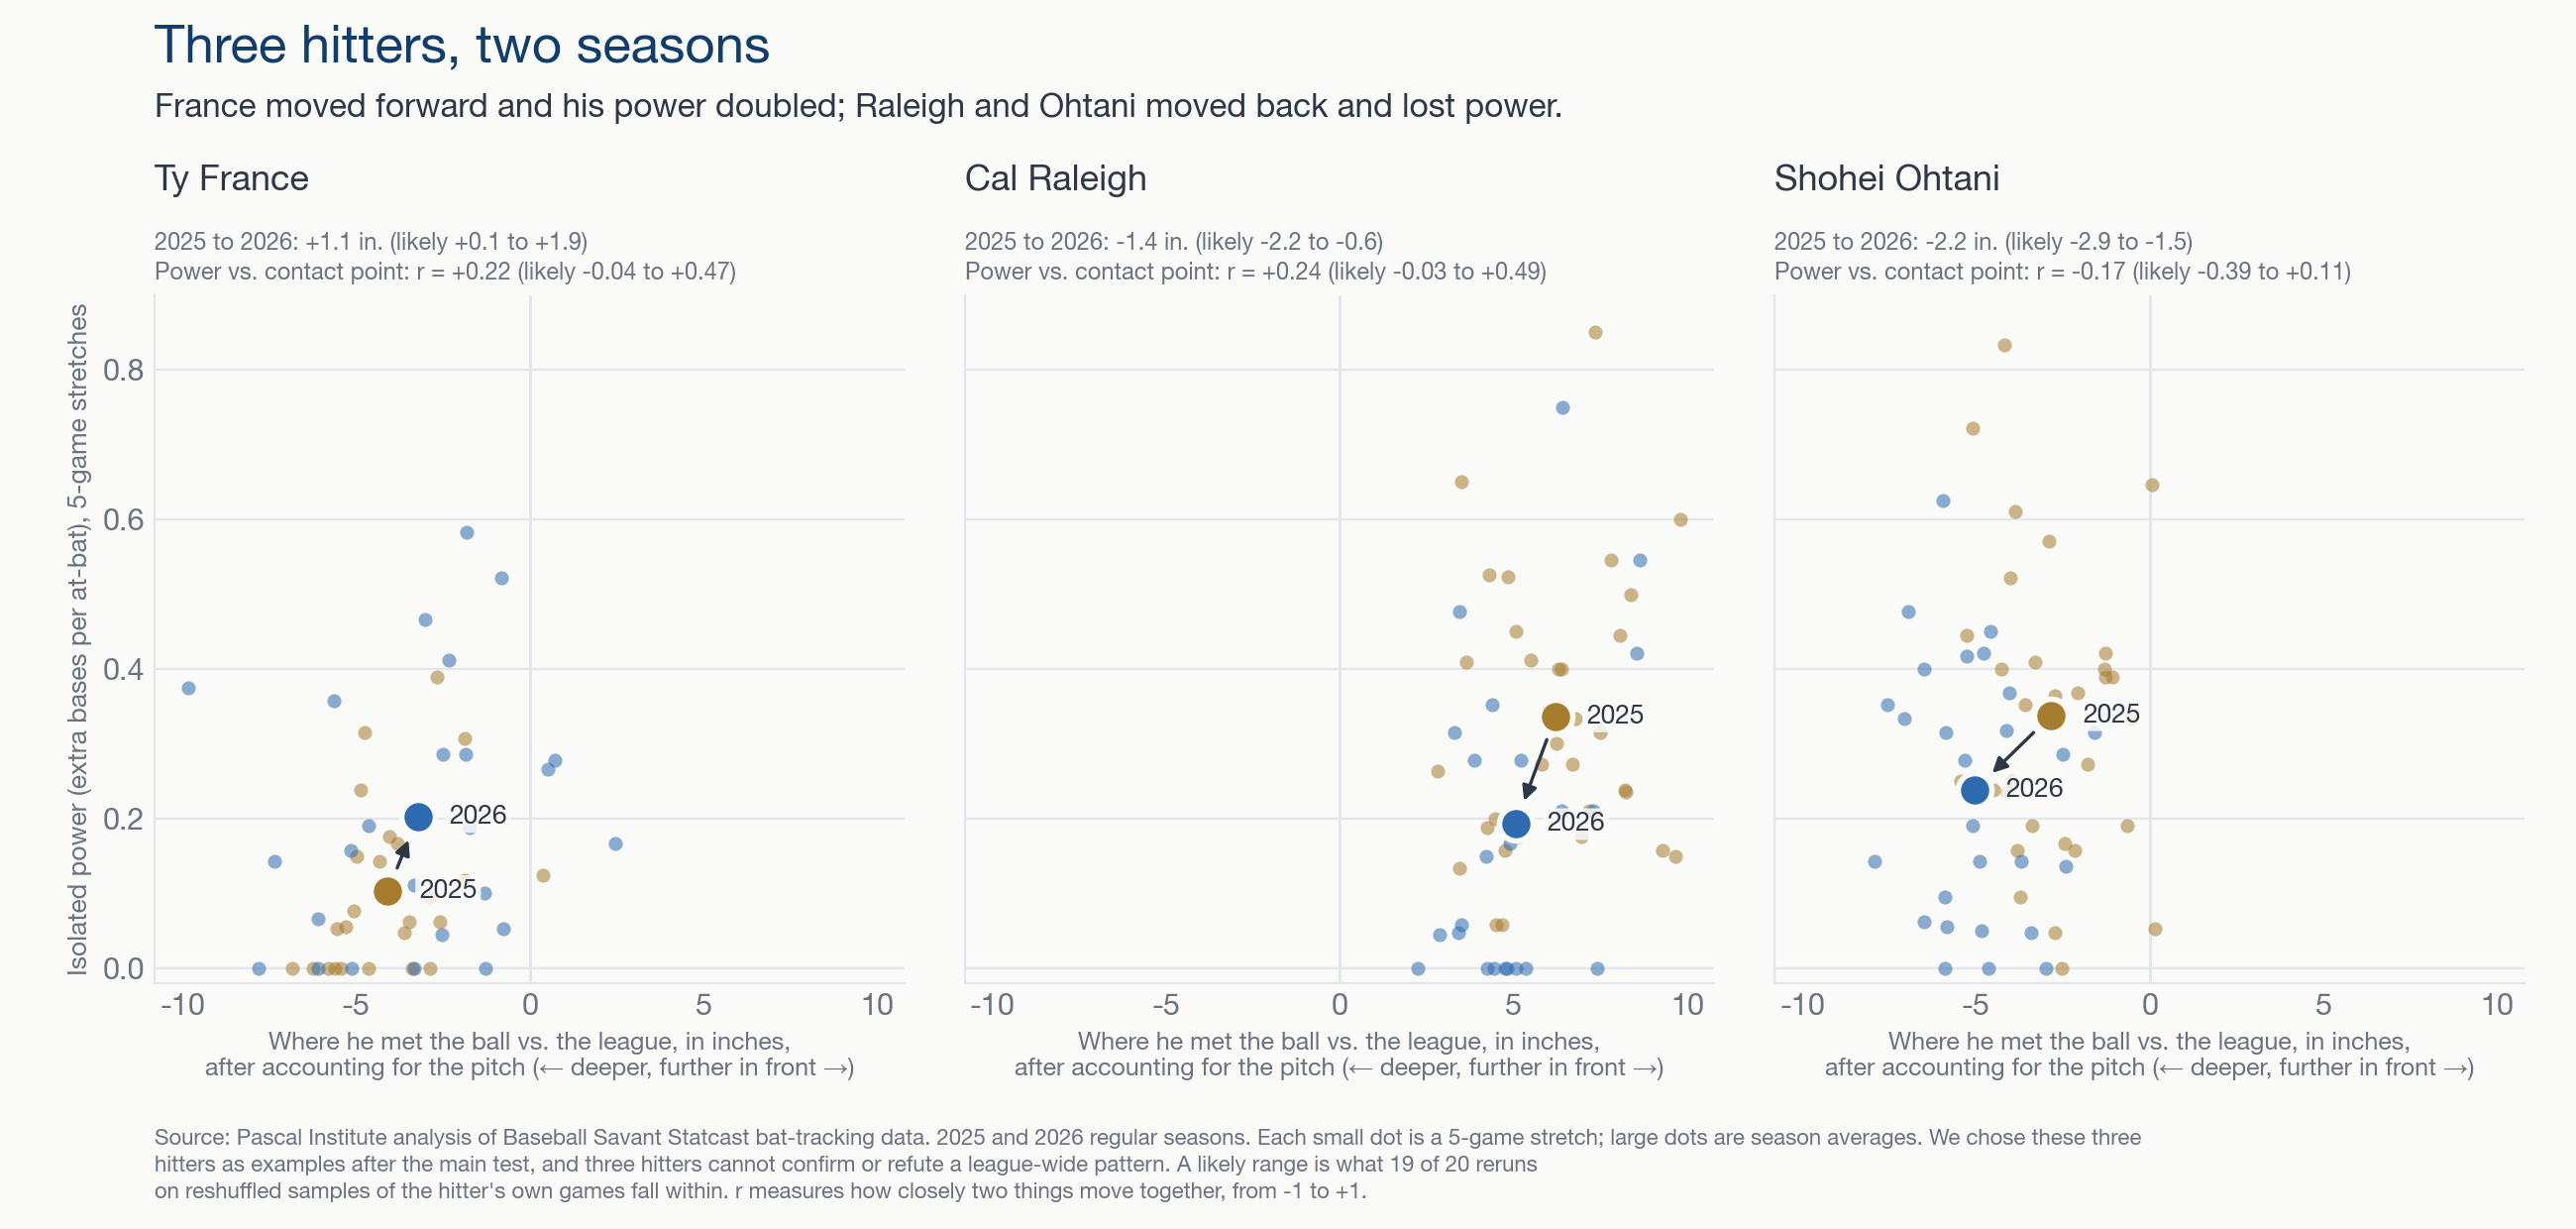
France met the ball about an inch further in front in 2026 than in 2025, with a likely range from 0.1 to 1.9 inches. Raleigh, who makes contact well in front of the league norm, met it about an inch and a half deeper. Ohtani met it about two inches deeper. Within each season, France's and Raleigh's power stretches lined up with their out-front stretches, while Ohtani's did not. None of those three links is strong enough to stand on its own. We chose these hitters as examples after the main test, so they cannot confirm a league-wide result, and nothing here says which came first.
What It Cannot Tell Us
This study began with a different idea. A hitter on a hot streak, the theory went, stops thinking and starts reacting, so his contact drifts forward, and a slumping hitter gets late. If that were true, contact point might flag a streak before the box score did. We tested whether a hitter's recent contact point improved a forecast of his next game: getting at least 1 hit, reaching at least 2 total bases, or hitting at least 1 home run.8
Under our models, it did not help in any of the three. Adding recent contact point to a hitter's recent results made the forecasts slightly worse, and no market prices were part of the test. The most likely reason is that by the time a shift in contact point is visible, his recent results already reflect it. Of the 7 tests we wrote down before looking at 2025, 2 passed: more home runs per batted ball out in front, and more power over 10-game stretches. The hot-streak version of the idea failed, and so did our own "fewer hits" version. We report both, because a measurement that cannot predict is still worth understanding.
What Late Means
Late is not a verdict on a hitter's ability to get hits. A hitter meeting the ball deeper than usual is, on average, trading home runs and doubles for singles, with roughly the same number of hits. Out in front is where home runs come from, and it is also where more swings miss. That makes contact point a useful description of which version of a hitter is showing up. It tells us whether we are seeing the power version or the contact version, but it is not a crystal ball. When a broadcast says a star is late, the better question is not whether he will get a hit tonight but whether the power is coming back. The full methods, the seven tests, and their limits are on the methodology page.9 For an earlier look at one hitter's contact point through a season, see our Cal Raleigh case study.10
Notes
- Baseball Savant, Statcast CSV documentation, field
intercept_ball_minus_batter_pos_y_inches: the distance between where bat met ball and the batter's center of mass, toward the pitcher. Data from Baseball Savant Statcast Search, regular seasons only. - Pascal Institute research, pitch adjustment fit separately for each season and batting side, with a separate baseline for each hitter. See the methodology page.
- Contact relative to the plate is the Statcast contact point minus the hitter's average depth in the batter's box, from Baseball Savant's Batting Stance leaderboard.
- Pascal Institute research, five groups of batted balls by pitch-adjusted contact point relative to each hitter's own season average, 2025 regular season. The 2026 season looks the same.
- Ben Clemens, "I Had an Idea About Bat Tracking Data", FanGraphs, Nov. 20, 2025.
- Pascal Institute research, stretches of 10 consecutive games for each hitter, compared within the same hitter.
- Pascal Institute research, three-hitter examples chosen after the main test. Likely ranges come from rerunning the comparison on reshuffled samples of each hitter's own games.
- Pascal Institute research, next-game forecasts trained only on earlier games, month by month, in the 2025 regular season.
- Pascal Institute, methodology for "Where Home Runs Come From".
- Pascal Institute, "When Regression Becomes Something More: Cal Raleigh".