
Late in the fourth quarter at AT&T Stadium, two coaches made the kind of call that gets credited, or blamed, on analytics. With 8:36 left and a 24-10 lead, Tampa Bay went for it on fourth-and-goal from the Dallas 1 instead of kicking a field goal. Sean Tucker was stopped for no gain.1 Dallas then drove 99 yards, scored to make it 24-16 with 5:30 left, and went for two. The pass fell incomplete, and Tampa Bay held on to win 24-16. Two aggressive calls produced two failures, and it is tempting to grade them the way the scoreboard did.
A result, though, is one draw from a range of things that could have happened. The useful question is what that range looked like before the snap. To answer it, we took the exact game state at each decision and ran it through nfl4th, an open-source fourth-down and two-point model built by Ben Baldwin. The same model powers his widely followed fourth-down bot.2 We ran it ourselves after the game, using only the situation before each snap. Our data run through Oct. 8, 2026.
The model speaks in win probability, the share of games a team in that exact situation would be expected to win. A point is one percentage point of that chance, so moving from 50% to 51% is a gain of one point. Before looking at any data, we set three labels for the gap between two choices. A gap of 2 points or more is clear, and 1 to 2 points is a lean. Less than 1 point is a toss-up, close enough to call a coin flip.
The model works the same way for every choice. It estimates how likely each possible result is, such as scoring from the 1 or being stopped, and the win probability that would follow each one. It then weights those win probabilities by how likely each result is, and it favors the choice with the higher total. That is why a play that often fails can still be the better bet, when failing costs little and succeeding gains a lot.
Tampa Bay: Failing Cost Very Little
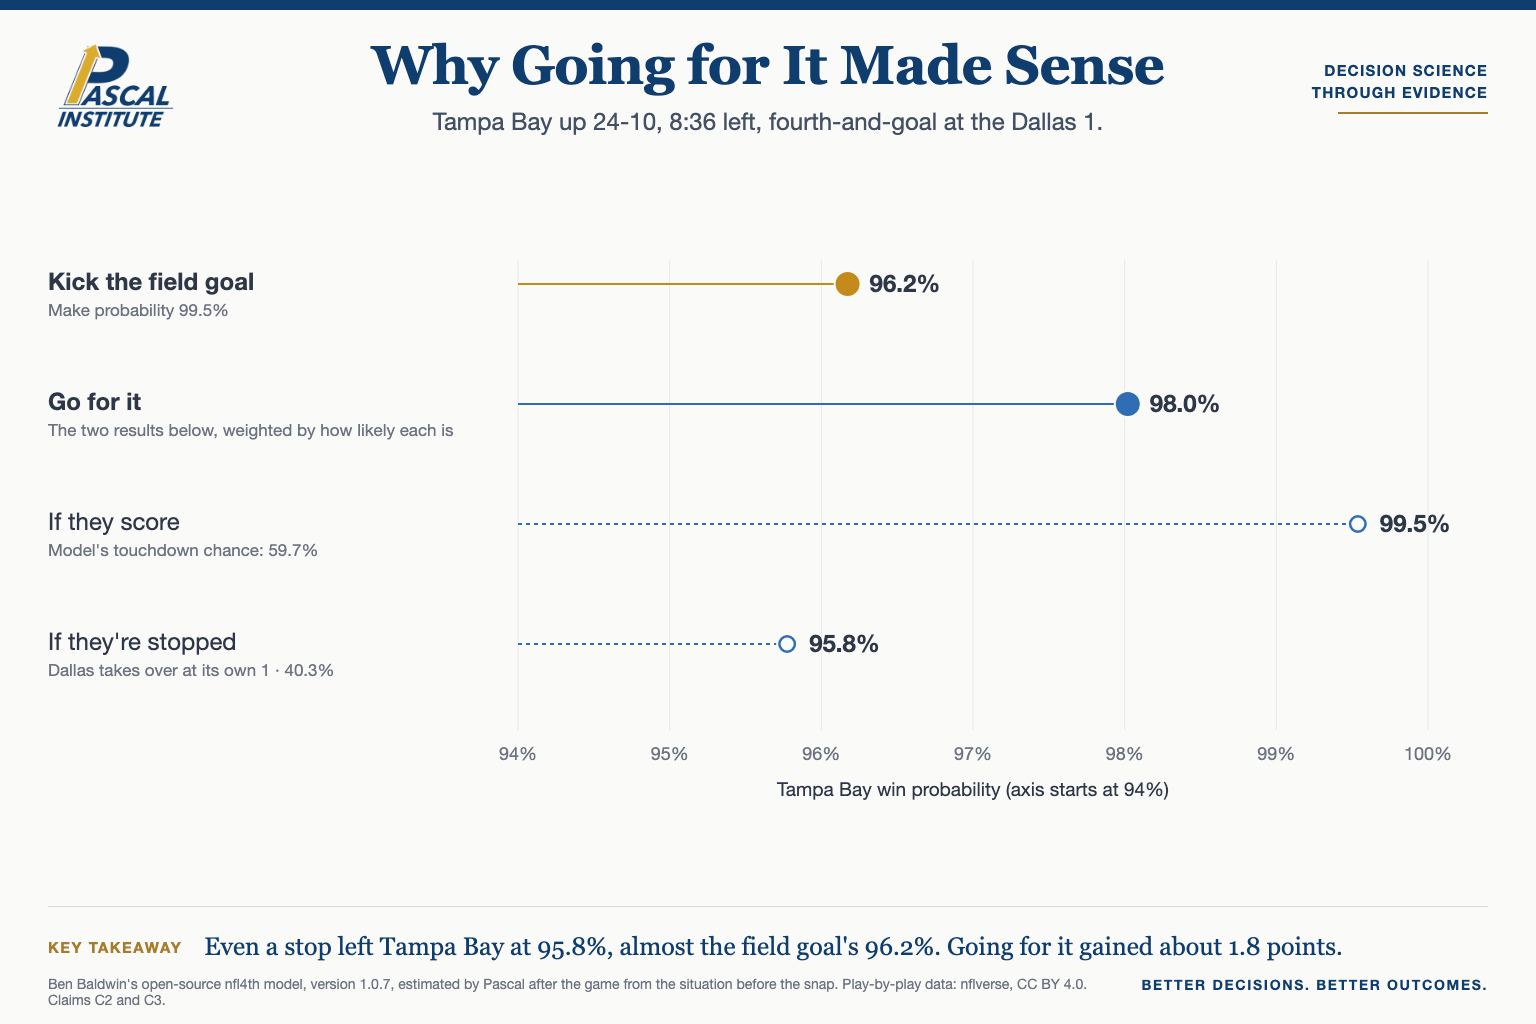
Under the model, Tampa Bay had a 98.0% chance to win by going for it and 96.2% by kicking the field goal. That gap of about 1.8 points makes going for it a lean rather than a clear call.2 The case against going for it is easy to state, because a field goal would have made it a three-score game. What that case misses is what happens when the attempt fails. Even if they were stopped, Tampa Bay would still win 95.8% of the time under the model. Dallas would take over at its own 1, so failing left Tampa Bay nearly at the 96.2% from kicking.
A stop at the goal line was barely worse than a field goal, and a touchdown was clearly better. The model put Tampa Bay's chance of scoring at 59.7%, and going for it was the better choice whenever that chance was above about 11%. League history agrees with the model's input. From 2015 to 2025, teams scored on 56% of fourth-and-goal plays from the 1 (195 of 348).3
Dallas: Closer Than Either Side Said
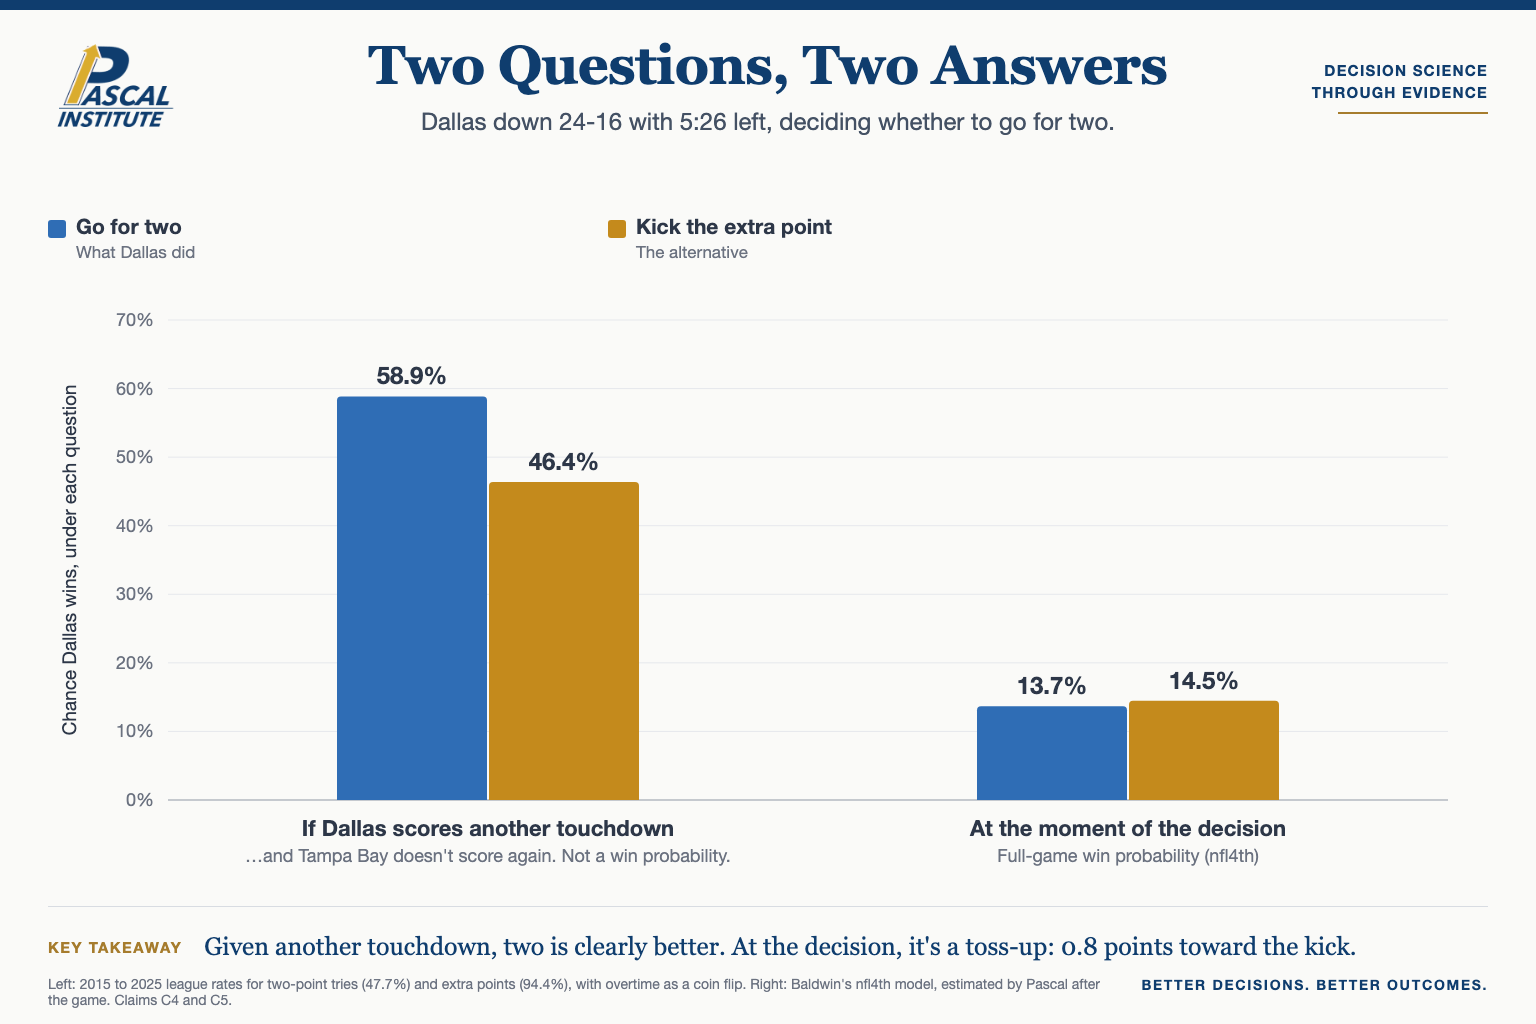
The same model gave Dallas a 13.7% chance to win by going for two and 14.5% by kicking the extra point. The gap of about 0.8 points leans toward the kick, but it falls in the toss-up range.2 Under the model, going for two needed to succeed about two-thirds of the time (65.7%) to be the better choice. The model gave Dallas a 53.7% chance, and league-wide, teams converted 48% of two-point tries from 2015 to 2025 (670 of 1,404).3
That may surprise anyone who has seen the case for going for two when down eight. The argument has a clean logic: go for two first, and Dallas learns early whether a second touchdown would win the game or only tie it. The widely shared version assumes Dallas scores another touchdown and Tampa Bay does not score again.4 Under that assumption, using league rates from 2015 to 2025, going for two wins about 59% of the time and kicking about 46%. That number answers a different question, what to do if Dallas scores again, and it is not Dallas's chance of winning.
The full-game model instead counts every way the game could unfold from that moment. That includes the ways in which Dallas never scores again, where the choice makes no difference. Under the model, trailing by 6 rather than 7 after the try was worth only about 2 points, 16.7% against 14.6%. That small gap is part of why the model does not favor going for two. The two approaches therefore disagree, one strongly favoring two and the other narrowly favoring the kick. We have not tested which view fits this situation better, so we report both.
What the Results Cannot Tell Us
Both calls failed. Under the model, one was a modest edge and the other was a coin flip, and the results alone cannot show which was which. Tampa Bay's stop still left it at about 96%. The model also expected Dallas's try to fail about 46% of the time, so a miss says nothing about whether trying was smart. A result is one draw from the range of outcomes, and it does not grade the decision that produced it.
Game states come from nflverse play-by-play, checked against ESPN's game data.15 The decision model is nfl4th version 1.0.7, run after the game on the situation before each snap. Its inputs include the pregame betting lines.2 We did not capture Baldwin's live bot posts, and we found no published verdict on these plays from ESPN, NFL Next Gen Stats, or EdjSports. The model's estimates are single values without published uncertainty, and it does not see how either team was playing that night, in-game injuries, or play calls. Our expectations before the data were the reverse of what the model found, and the methodology page sets them out with the rest of the method.6
The habit worth building is to judge a call by what was known before the snap, as we argued in "Not All Field Goals Weigh the Same."7 Readers who want to test their own calls the same way can use AnalytIQ's Decision Journal, which records a decision before the result is known and brings it back once the outcome arrives.
Notes
- nflverse, NFL play-by-play data, game 2026_05_TB_DAL, Tampa Bay at Dallas, Oct. 8, 2026. Licensed CC BY 4.0.
- Ben Baldwin, nfl4th, version 1.0.7, run by Pascal Institute on the situation before each snap. See the methodology page.
- Pascal Institute research, league rates from nflverse play-by-play, 2015 to 2025 seasons, regular season and postseason.
- R.J. Coyle, "Here's the math, strategy behind why Cowboys went for two late in loss to Buccaneers", Yahoo Sports, Oct. 10, 2026, which adapts Seth Walder's ESPN explainer on going for two when down eight. Pascal Institute recomputed the calculation with 2015 to 2025 league rates.
- ESPN, game data for Tampa Bay at Dallas, Oct. 8, 2026.
- Pascal Institute, methodology for "One Lean, One Coin Flip".
- Pascal Institute, "Not All Field Goals Weigh the Same".