
Forecasting · Model validation
Forecasting the World Series, and Testing It Against the Market
This case study retells research that Pascal Institute has published, with links to the full articles and their methods below. It is not a client engagement.
The question
When the 2026 regular season ended, we set out to forecast the World Series from the Pascal Rating for each MLB team and from each club’s probable starting pitchers. We froze the forecast before the first postseason pitch so that it could be scored honestly afterwards. Milwaukee finished with the best record in baseball and the highest rating, and both of our methods made the Brewers a slight favorite: 22.5 percent in the first method and 21.7 percent in the second, with the Dodgers at 21.4 and 20.6 percent. The futures market, with the bookmakers’ margin removed, priced the Dodgers at 27.6 percent and Milwaukee at 14.8 percent. The title odds for every playoff team are on the 2026 World Series page.
How we built it
We built two forecasts from the same ratings, so that any disagreement between them would come from how each prices a single game. The first simulates the bracket. It turns each rating into a winning percentage, pulls that percentage toward .500 by an amount we measured rather than assumed, and plays every series game by game 200,000 times, drawing each team’s strength from the uncertainty in its rating. The second is a machine learning model trained on about 22,000 regular-season games from 2015 through 2025 and run through the same bracket.
We then tested inputs one at a time. Starting pitchers, measured against their own rotation, improved regular-season predictions in both methods. Bullpens added nothing once the ratings and starters were known, because a team’s runs allowed already reflect its relievers.
How we validated it
Before trusting either method, we replayed the postseasons from 2015 through 2025, leaving out 2020, with each season held out of the fitting used to forecast it. Both methods beat a home-field baseline on regular-season games and gave the eventual champion more probability than a random pick. In postseason games, though, the advantage was too small to separate from zero, and the article says so.
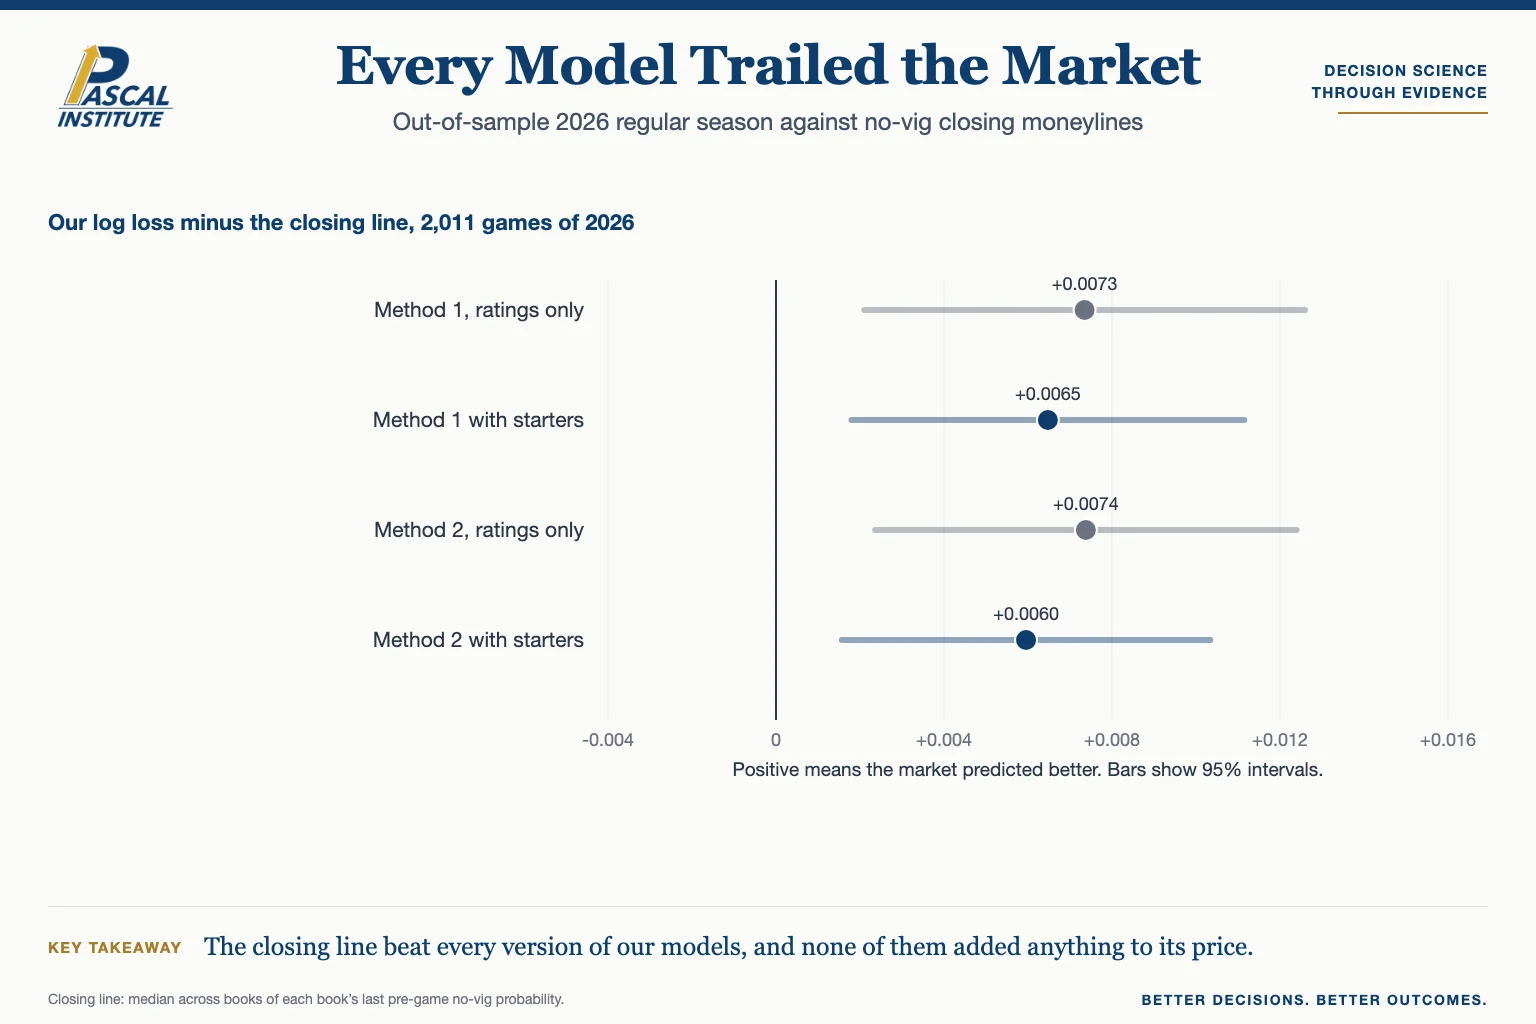
The harder test was the market. On 2,011 games of the 2026 regular season that the models never trained on, the closing line’s log loss was 0.6783 and our headline model’s was 0.6843. Every version of our models trailed the market. When we blended each model with the closing line and let the data choose the weights, the weight on our model was indistinguishable from zero. Once you know the market’s price, our forecast adds nothing to it. Title futures from 2022 through 2025 pointed the same way.
What it shows
The forecast is still useful. It is honest about its uncertainty, it can be checked, and it can say how much of a team’s chance comes from its rating, from home field and from its starting pitcher, which a price cannot. But a decision that depends on beating a market needs information the market lacks, and a model built only from public results does not have it. We published that conclusion with the forecast, before the outcome, and we will score all three views against the result when the World Series ends.
What this means for your organization
Most organizations that build a forecast already have a benchmark that is harder to beat than it looks: a vendor model, a consensus estimate, a market price, or the judgment of experienced staff. The useful questions are the ones this study asked. Does the forecast beat a simple baseline out of sample? Are its probabilities calibrated? Does it add information to the benchmark you already have, or only restate it? Which inputs earn their place, and which only add complexity? We can build that kind of forecast with you, or test the one you have, and report the answer whichever way it comes out.